- Don’t miss your chance to experience Discovery Summit Europe at our best available rate! Early bird registration through 31 Oct.
- Graph Builder Toolbar streamlines interactive graphing. Creates shortcuts on Report and GraphBuilder Helpers toolbars. Download and install the extension.
- Subscribe to RSS Feed
- Mark Topic as New
- Mark Topic as Read
- Float this Topic for Current User
- Bookmark
- Subscribe
- Mute
- Printer Friendly Page
Discussions
Solve problems, and share tips and tricks with other JMP users.- User Community
- :
- Discussions
- :
- Re: How to prove similarity between two curve? What are different approach or op...

- Mark as New
- Bookmark
- Subscribe
- Mute
- Subscribe to RSS Feed
- Get Direct Link
- Report Inappropriate Content
How to prove similarity between two curve? What are different approach or options in JMP?
Dear Users,
I have two spectral data set and my objective is to prove similarity between two curves? How to prove similarity between two curve? What are different approach or options in JMP? Datasheet attached for reference where I want to prove how similar Y1 with Y2 or viceversa.
Accepted Solutions


- Mark as New
- Bookmark
- Subscribe
- Mute
- Subscribe to RSS Feed
- Get Direct Link
- Report Inappropriate Content
Re: How to prove similarity between two curve? What are different approach or options in JMP?
First of all, we use statistics to help us decide about a hypothesis. We cannot use it to prove anything. Second of all, you only have one curve from each population, so no statistical inference is possible.
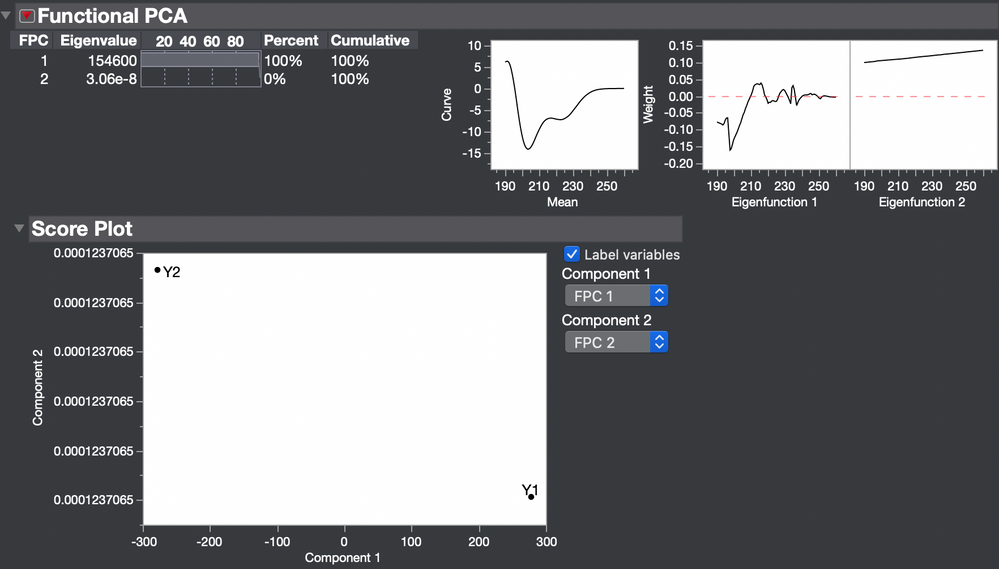
You might use the Functional Data Explorer in JMP Pro to fit a basis expansion model to each curve and then examine the functional principal components. There would be essentially a single such component if the curves are similar or two if they are not similar.
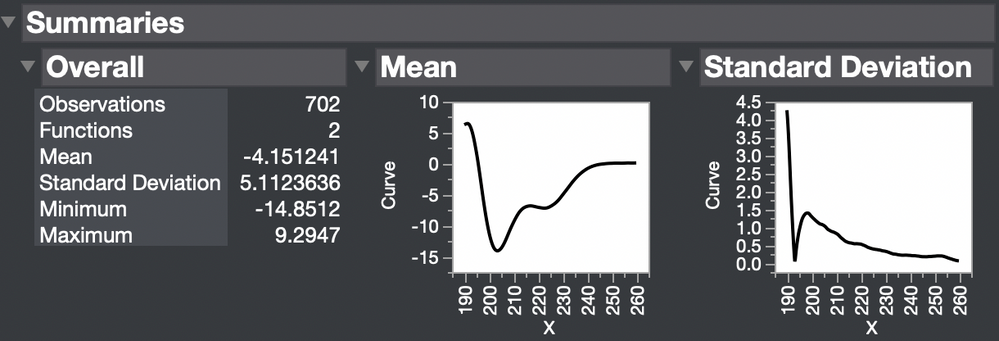
The summary of your curves shows the common shape (mean function) and the variation (standard deviation function), which is greatest at the start of the curve.
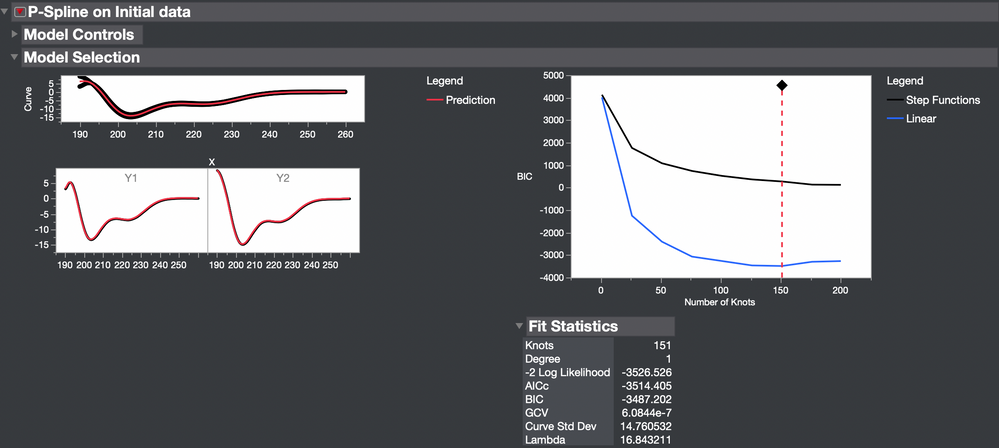
The penalized spline model gave the best fit.
In your case, there seems to be only one shape.


- Mark as New
- Bookmark
- Subscribe
- Mute
- Subscribe to RSS Feed
- Get Direct Link
- Report Inappropriate Content
Re: How to prove similarity between two curve? What are different approach or options in JMP?
Some thoughts:
1. I would first determine if the differences are of any practical significance. How much of a difference in the response that is plotted is meaningful (do you care about from a practical standpoint).
2. Use many comparisons:
- Similar points along the x-axis on each curve (differences between these)
- Slopes between different sections of the curve
- Max/min values
There is no one right way! And as Mark points out, you can't prove anything...only increase your degree of confidence that the curves are similar or not.
- Mark as New
- Bookmark
- Subscribe
- Mute
- Subscribe to RSS Feed
- Get Direct Link
- Report Inappropriate Content
Re: How to prove similarity between two curve? What are different approach or options in JMP?
First of all, we use statistics to help us decide about a hypothesis. We cannot use it to prove anything. Second of all, you only have one curve from each population, so no statistical inference is possible.
You might use the Functional Data Explorer in JMP Pro to fit a basis expansion model to each curve and then examine the functional principal components. There would be essentially a single such component if the curves are similar or two if they are not similar.
The summary of your curves shows the common shape (mean function) and the variation (standard deviation function), which is greatest at the start of the curve.
The penalized spline model gave the best fit.
In your case, there seems to be only one shape.
- Mark as New
- Bookmark
- Subscribe
- Mute
- Subscribe to RSS Feed
- Get Direct Link
- Report Inappropriate Content
Re: How to prove similarity between two curve? What are different approach or options in JMP?
Thanks for quick reply,
As variation and shape is similar Can I say both curves are similar in nature?
Objective here is to see whether these two curves are similar or not (Hypothesis)? How to measure similarity or difference ? (by mean or by shape or point to point correlation or by variation at various stages?) Which method is best to address this situation?
As I don't have JMP pro can I use any other method for similarity in JMP?

- Mark as New
- Bookmark
- Subscribe
- Mute
- Subscribe to RSS Feed
- Get Direct Link
- Report Inappropriate Content
Re: How to prove similarity between two curve? What are different approach or options in JMP?
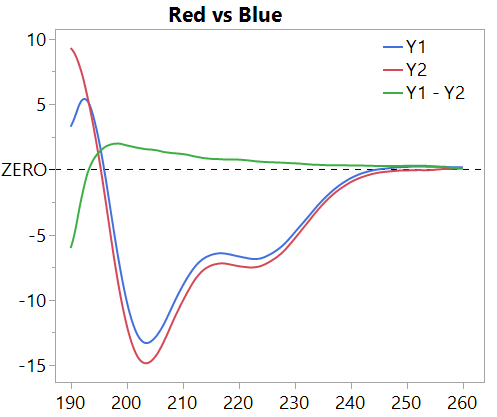
Plotting the difference (green) between the two curves shows something that is hard to see from the red and blue curves because of the steep slope: the difference is smoothly getting smaller after 198 or so.
- Mark as New
- Bookmark
- Subscribe
- Mute
- Subscribe to RSS Feed
- Get Direct Link
- Report Inappropriate Content
Re: How to prove similarity between two curve? What are different approach or options in JMP?
Some thoughts:
1. I would first determine if the differences are of any practical significance. How much of a difference in the response that is plotted is meaningful (do you care about from a practical standpoint).
2. Use many comparisons:
- Similar points along the x-axis on each curve (differences between these)
- Slopes between different sections of the curve
- Max/min values
There is no one right way! And as Mark points out, you can't prove anything...only increase your degree of confidence that the curves are similar or not.

- Mark as New
- Bookmark
- Subscribe
- Mute
- Subscribe to RSS Feed
- Get Direct Link
- Report Inappropriate Content
Re: How to prove similarity between two curve? What are different approach or options in JMP?
I have a question for you. You say that the 2 curves Y1 and Y2 are similar. And I agree with you. But how the score plot should be interpreted? The two points are far each other.
Thanks Felice
- Mark as New
- Bookmark
- Subscribe
- Mute
- Subscribe to RSS Feed
- Get Direct Link
- Report Inappropriate Content
Re: How to prove similarity between two curve? What are different approach or options in JMP?
Yes, there is a difference between the two curves. They are not identical curves.
The first functional principal component captures essentially all the variation between the two curves. FDE usually works with a larger sample so that the FPCs tend to separate the fixed effects (attributable) and random effects (not attributable). The fixed effects dominate the first FPCs and the random effects dominate the last FPCs. You have only two curves so only two FPCs are possible. There is only one difference between curves so only one real FPC.
Be careful about judging distance in this plot. (The vertical dimension has zero length.) Rather, the plot simply indicates that the two curves Y1 and Y2 are most different out of all the curves, but these two curves are the only curves in the sample.
Recommended Articles
- © 2026 JMP Statistical Discovery LLC. All Rights Reserved.
- Terms of Use
- Privacy Statement
- Contact Us