Turn on suggestions
Auto-suggest helps you quickly narrow down your search results by suggesting possible matches as you type.
- New to JMP? Join us Sept. 23-24 for the Early User Edition of Discovery Summit, tailor-made for new users. Register now for free!
- Your voice matters! Tell us how you prefer to receive JMP updates, so we can tailor our communication to your needs. Take short survey.
- See how to access JMP Marketplace - and - find, create & share add-ins to extend your JMP. Watch video.
Options
- Subscribe to RSS Feed
- Mark Topic as New
- Mark Topic as Read
- Float this Topic for Current User
- Bookmark
- Subscribe
- Mute
- Printer Friendly Page
Discussions
Solve problems, and share tips and tricks with other JMP users.- JMP User Community
- :
- Discussions
- :
- How to plot distributions at Graph Builder (instead of box plots)

Level I
- Mark as New
- Bookmark
- Subscribe
- Mute
- Subscribe to RSS Feed
- Get Direct Link
- Report Inappropriate Content
How to plot distributions at Graph Builder (instead of box plots)
Apr 18, 2024 05:40 AM
(3321 views)
Hello,
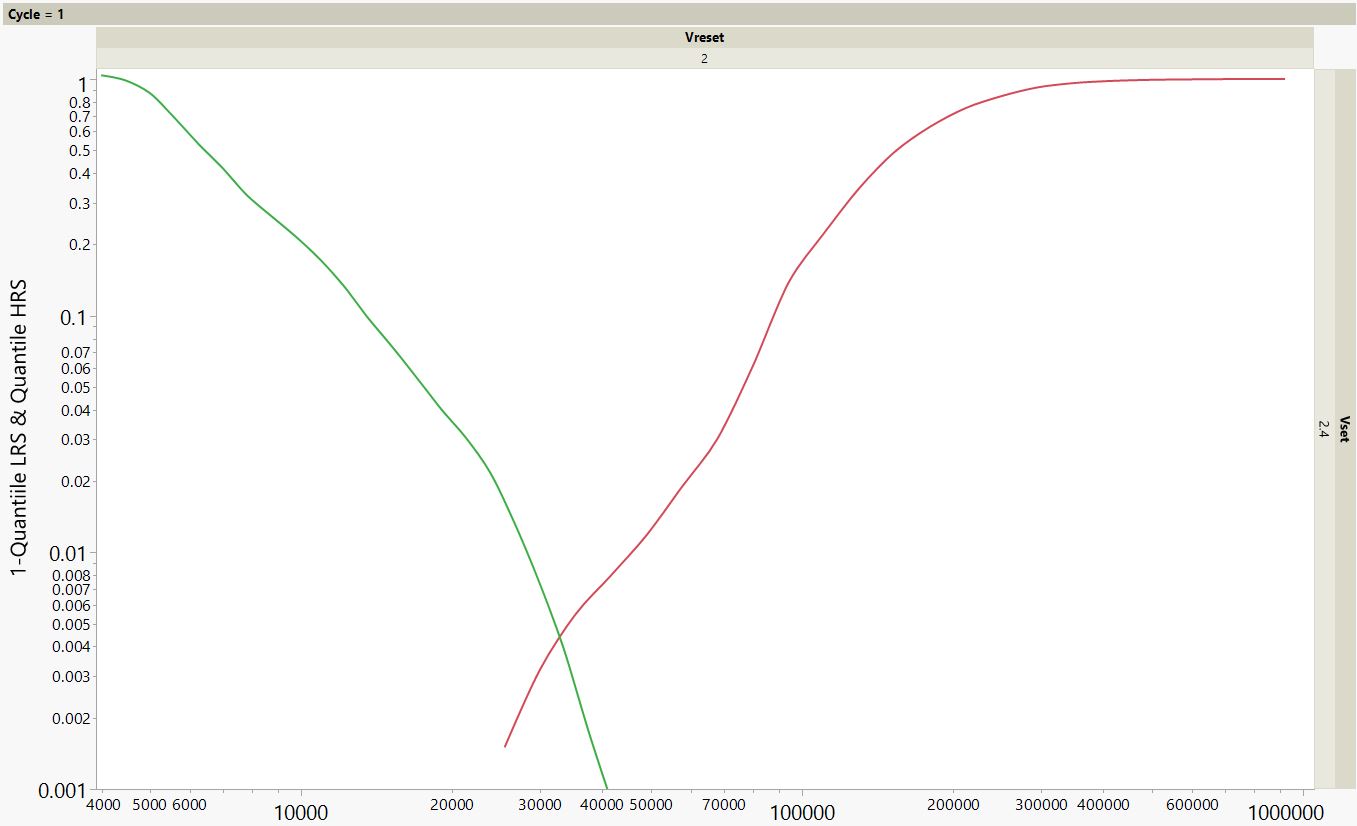
I'm looking for a way to present the data from Graph Builder in a way of distributions instead of the box plots (as in the JRP attachment). Basically I want each graph builder square to look like JPG attachment.
Is it possible? Can anyone help me out?
3 REPLIES 3

Level VII
- Mark as New
- Bookmark
- Subscribe
- Mute
- Subscribe to RSS Feed
- Get Direct Link
- Report Inappropriate Content
Re: How to plot distributions at Graph Builder (instead of box plots)
It is infinitely more helpful if an example table to tinker around with is provided. Have you tried the different summary statistic options in the Graph Builder?

Level I
- Mark as New
- Bookmark
- Subscribe
- Mute
- Subscribe to RSS Feed
- Get Direct Link
- Report Inappropriate Content
Re: How to plot distributions at Graph Builder (instead of box plots)
Hi,
I'm attaching the JRP file with the table. Don't know how it was skipped before - sorry. Thanks for your help

Super User
- Mark as New
- Bookmark
- Subscribe
- Mute
- Subscribe to RSS Feed
- Get Direct Link
- Report Inappropriate Content
Re: How to plot distributions at Graph Builder (instead of box plots)
If you want a bunch of mini-graphs combined into one graph, try the Wrap option.

dt = open("$sample_data\Bands Data.jmp");

gb = dt << Graph Builder(
	Size( 1832, 943 ),
	Show Control Panel( 0 ),
	Variables( X( :timestamp ), Y( :viscosity ), Wrap( :customer ) ),
	Elements( Bar( X, Y, Legend( 7 ) ) )
);
Recommended Articles
- © 2026 JMP Statistical Discovery LLC. All Rights Reserved.
- Terms of Use
- Privacy Statement
- Contact Us