- Subscribe to RSS Feed
- Mark Topic as New
- Mark Topic as Read
- Float this Topic for Current User
- Bookmark
- Subscribe
- Mute
- Printer Friendly Page
Discussions
Solve problems, and share tips and tricks with other JMP users.- JMP User Community
- :
- Discussions
- :
- Re: How to optimize factors with uncertainty in 1 step with JMP?
- Mark as New
- Bookmark
- Subscribe
- Mute
- Subscribe to RSS Feed
- Get Direct Link
- Report Inappropriate Content
How to optimize factors with uncertainty in 1 step with JMP?
Hello community!!,
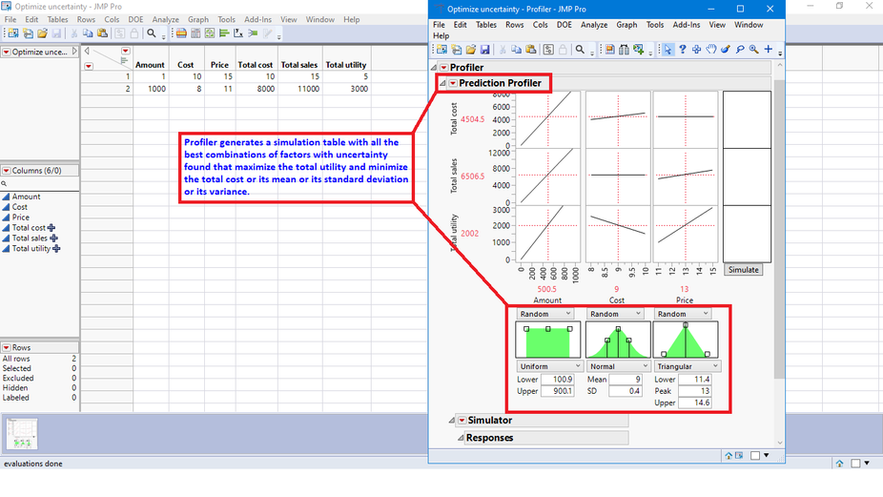
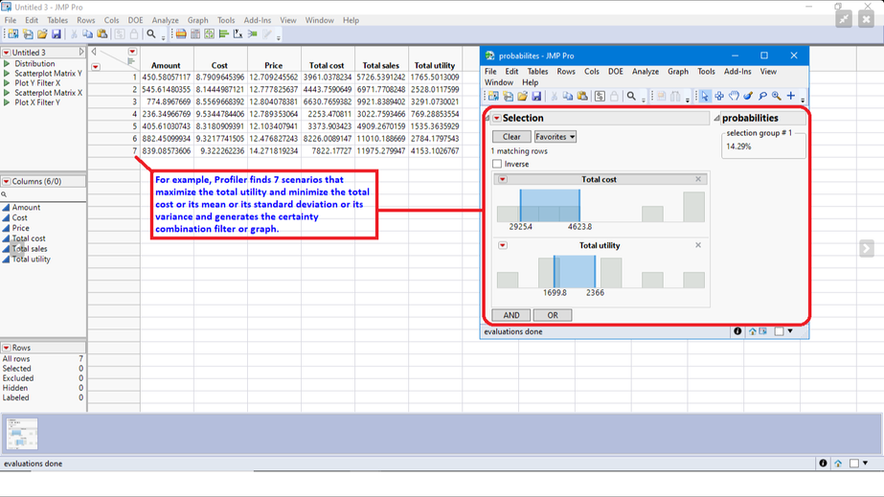
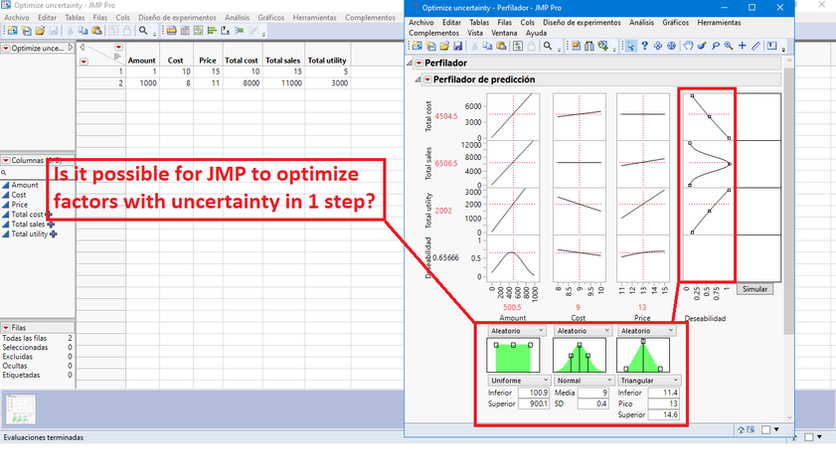
A question: will it be possible for the profiler to find the best combinations of factors with uncertainty when performing a simulation, which maximize the total utility and minimize the total cost, generating a table of the best combinations found? For example:
- Tags:
- windows
- Mark as New
- Bookmark
- Subscribe
- Mute
- Subscribe to RSS Feed
- Get Direct Link
- Report Inappropriate Content
Re: How to optimize factors with uncertainty in 1 step with JMP?
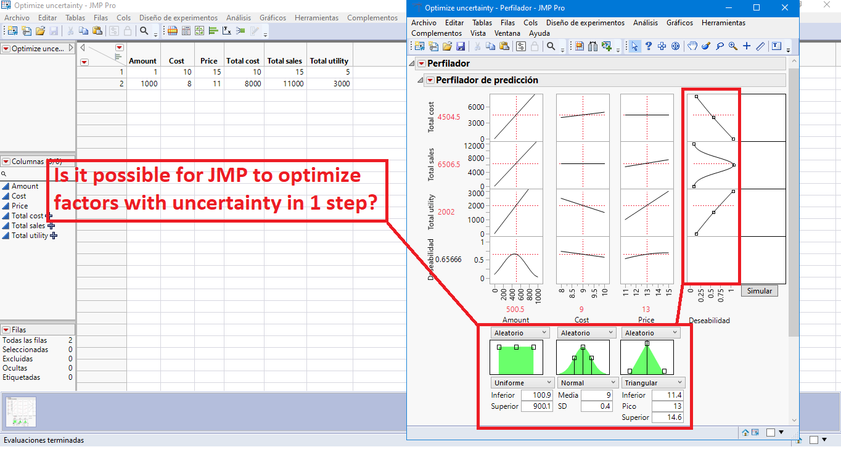
Your first screenshot of the Prediction Profiler does not show the Desirability Functions. These functions are used to optimize settings across all the response goals and importance settings. That action usually occurs before simulation to assess capability.
- Mark as New
- Bookmark
- Subscribe
- Mute
- Subscribe to RSS Feed
- Get Direct Link
- Report Inappropriate Content
Re: How to optimize factors with uncertainty in 1 step with JMP?
Hello Mark,
I am happy to greet you! Thank you for the observation... I would like to know if it is possible for JMP to optimize the factors with uncertainty in 1 step.
Greetings,
Marco
- Mark as New
- Bookmark
- Subscribe
- Mute
- Subscribe to RSS Feed
- Get Direct Link
- Report Inappropriate Content
Re: How to optimize factors with uncertainty in 1 step with JMP?
You optimize the mean response using desirability functions. The uncertainty is presented as a confidence interval for the response. You then use simulation with injected variance for each significant factor. You represented the anticipated uncertainty or degree of control through the specification of the injected variance. The distribution of simulated responses is evaluated against specifications.
The Design Space Profiler is an alternate way.
- Mark as New
- Bookmark
- Subscribe
- Mute
- Subscribe to RSS Feed
- Get Direct Link
- Report Inappropriate Content
Re: How to optimize factors with uncertainty in 1 step with JMP?
Note that JMP 17 introduced an enhancement to the Prediction Profiler: the Design Space Profiler. It allows you to determine operating ranges for your factors to achieve a given yield against specifications. This tool might be useful in your attempt.
- Mark as New
- Bookmark
- Subscribe
- Mute
- Subscribe to RSS Feed
- Get Direct Link
- Report Inappropriate Content
Re: How to optimize factors with uncertainty in 1 step with JMP?
related post: Could JMP optimize factors with uncertainty?
- Mark as New
- Bookmark
- Subscribe
- Mute
- Subscribe to RSS Feed
- Get Direct Link
- Report Inappropriate Content
Re: How to optimize factors with uncertainty in 1 step with JMP?
Hello Hogi,
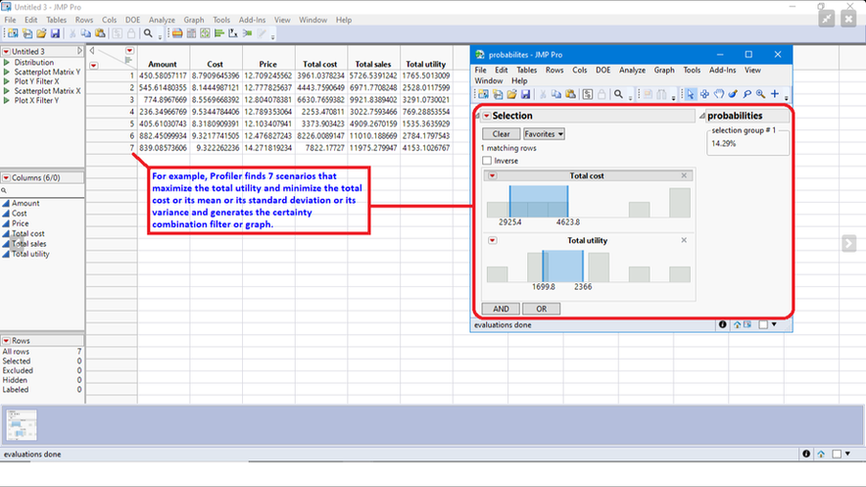
I am glad to greet you, the uncertainty graph with the filters that you created work very well!!!....one question: will it be possible for the profiler to find the best combinations of factors with uncertainty when carrying out a simulation, which maximize the usefulness total and minimize the total cost, generating a table of the best combinations found? For example:
- Mark as New
- Bookmark
- Subscribe
- Mute
- Subscribe to RSS Feed
- Get Direct Link
- Report Inappropriate Content
Re: How to optimize factors with uncertainty in 1 step with JMP?
Thanks for your response Mark, the idea is to solve problems without specification limits, Design Space Profiler requires specification limits
- Mark as New
- Bookmark
- Subscribe
- Mute
- Subscribe to RSS Feed
- Get Direct Link
- Report Inappropriate Content
Re: How to optimize factors with uncertainty in 1 step with JMP?
You only need to use desirability functions with the selected model in the Prediction Profiler to optimize factor settings.
- Mark as New
- Bookmark
- Subscribe
- Mute
- Subscribe to RSS Feed
- Get Direct Link
- Report Inappropriate Content
Re: How to optimize factors with uncertainty in 1 step with JMP?
In this case, how could I do it?
Recommended Articles
- © 2026 JMP Statistical Discovery LLC. All Rights Reserved.
- Terms of Use
- Privacy Statement
- Contact Us
