- Don’t miss your chance to experience Discovery Summit Europe at our best available rate! Early bird registration through 31 Oct.
- Graph Builder Toolbar streamlines interactive graphing. Creates shortcuts on Report and GraphBuilder Helpers toolbars. Download and install the extension.
- Subscribe to RSS Feed
- Mark Topic as New
- Mark Topic as Read
- Float this Topic for Current User
- Bookmark
- Subscribe
- Mute
- Printer Friendly Page
Discussions
Solve problems, and share tips and tricks with other JMP users.- User Community
- :
- Discussions
- :
- Re: How to modify the heading of the bivariate analysis plot

- Mark as New
- Bookmark
- Subscribe
- Mute
- Subscribe to RSS Feed
- Get Direct Link
- Report Inappropriate Content
How to modify the heading of the bivariate analysis plot
Hello,
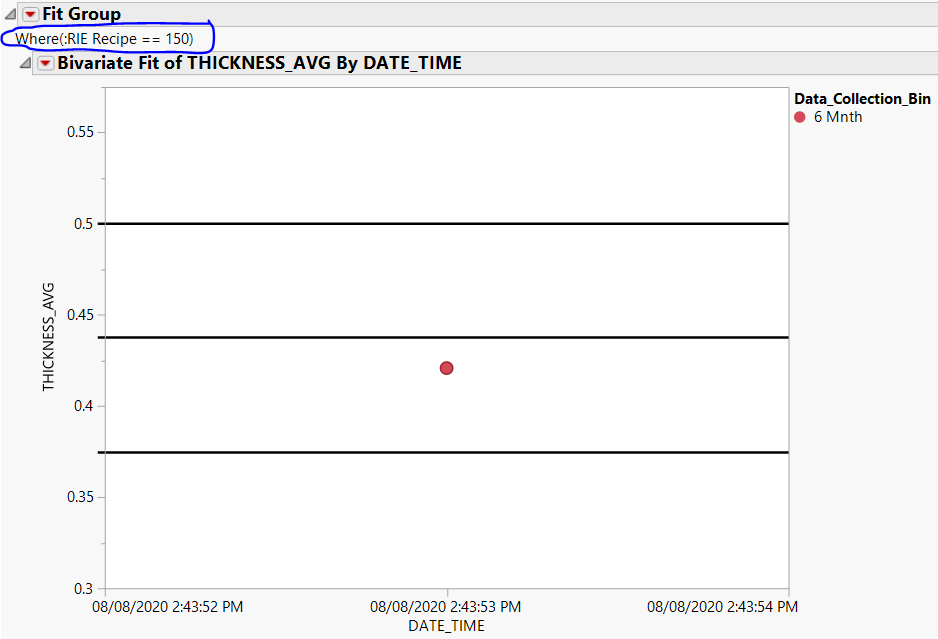
I am trying to create a plot with the script below. When I create the plot using the Analysis tab in JMP, I get the plot as shown in the image named "Bivariate_Fit_Desired.PNG". While I put the same script in JSL, I get the plot as shown as in the image named "Bivariate_Fit_toFix.PNG". The area where I have the issue is circled in the images and the script is below. Thanks in advance.
Best
Debraj
ns:dt <<Fit Group(
Bivariate(
Y( :THICKNESS_AVG ),
X( :DATE_TIME ),
Fit Spline( 0.1, Standardized, {Line Color( {213, 72, 87} )} ),
Where( :RIE Recipe == 150 ),
SendToReport(
Dispatch(
{},
"2",
ScaleBox,
{Max( 0.575 ), Add Ref Line( LCL_150_M, "Solid", "Black", "", 2 ),
Add Ref Line( CL_150_M, "Solid", "Black", "", 2 ),
Add Ref Line( UCL_150_M, "Solid", "Black", "", 2 )}
),
Dispatch(
{},
"Bivar Plot",
FrameBox,
{Frame Size( 547, 401 ), Marker Size( 6 ),
Marker Drawing Mode( "Outlined" ),
Row Legend(
:Data_Collection_Bin,
Color( 1 ),
Color Theme( "JMP Default" ),
Marker( 0 ),
Marker Theme( "" ),
Continuous Scale( 0 ),
Reverse Scale( 0 ),
Excluded Rows( 0 )
)}
)
)
),
- Tags:
- Mass Customization
Accepted Solutions


- Mark as New
- Bookmark
- Subscribe
- Mute
- Subscribe to RSS Feed
- Get Direct Link
- Report Inappropriate Content
Re: How to modify the heading of the bivariate analysis plot
Run your analysis again by hand and compare the "save script" to the "save by group" script.
- Mark as New
- Bookmark
- Subscribe
- Mute
- Subscribe to RSS Feed
- Get Direct Link
- Report Inappropriate Content
Re: How to modify the heading of the bivariate analysis plot
Run your analysis again by hand and compare the "save script" to the "save by group" script.
- Mark as New
- Bookmark
- Subscribe
- Mute
- Subscribe to RSS Feed
- Get Direct Link
- Report Inappropriate Content
Re: How to modify the heading of the bivariate analysis plot
Recommended Articles
- © 2026 JMP Statistical Discovery LLC. All Rights Reserved.
- Terms of Use
- Privacy Statement
- Contact Us