cancel
Showing results for 
Show  only  | Search instead for 
Did you mean: 
‘New to using JMP? Hit the ground running with the Early User Edition of Discovery Summit – register now, free of charge.
Register for our Discovery Summit 2024 conference, Oct. 21-24, where you’ll learn, connect, and be inspired.
Choose Language Hide Translation Bar
SengYew
Level I

How to interpret lambda values from Box Cox Y Transformation?

Hi,

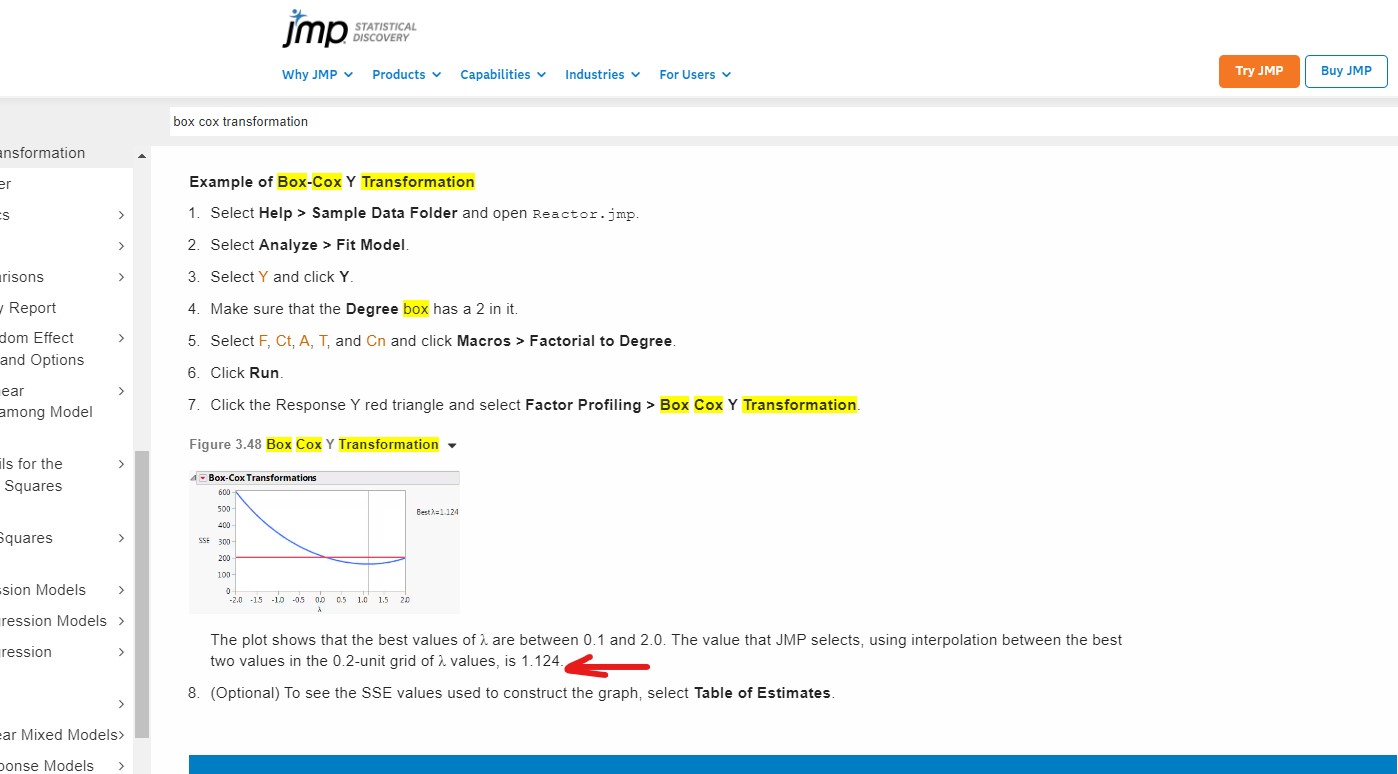
From the Figure 3.48 Box Cox Y Transformation from JMP webpage

The plot shows that the best values of λ are between 0.1 and 2.0. The value that JMP selects, using interpolation between the best two values in the 0.2-unit grid of λ values, is 1.124.


https://www.jmp.com/support/help/en/17.0/#page/jmp/box-cox-y-transformation.shtml


I would like to know how to interpret this lambda value : 1.124. After interpret, what should I do? will this data transform to normality?

1 REPLY 1
MRB3855
Super User

Re: How to interpret lambda values from Box Cox Y Transformation?

Hi @SengYew : You may want to start here.

https://en.wikipedia.org/wiki/Power_transform