- Instantly extract effect sizes, F-ratios, and FDR-adjusted p-values from your models with the Calculate Effects Sizes extension, available now in the JMP Marketplace!
- New to JMP? Join us Sept. 23-24 for the Early User Edition of Discovery Summit, tailor-made for new users. Register now for free!
- Your voice matters! Tell us how you prefer to receive JMP updates, so we can tailor our communication to your needs. Take short survey.
- Subscribe to RSS Feed
- Mark Topic as New
- Mark Topic as Read
- Float this Topic for Current User
- Bookmark
- Subscribe
- Mute
- Printer Friendly Page
Discussions
Solve problems, and share tips and tricks with other JMP users.- JMP User Community
- :
- Discussions
- :
- Re: How to implement variance decomposition

- Mark as New
- Bookmark
- Subscribe
- Mute
- Subscribe to RSS Feed
- Get Direct Link
- Report Inappropriate Content
How to implement variance decomposition
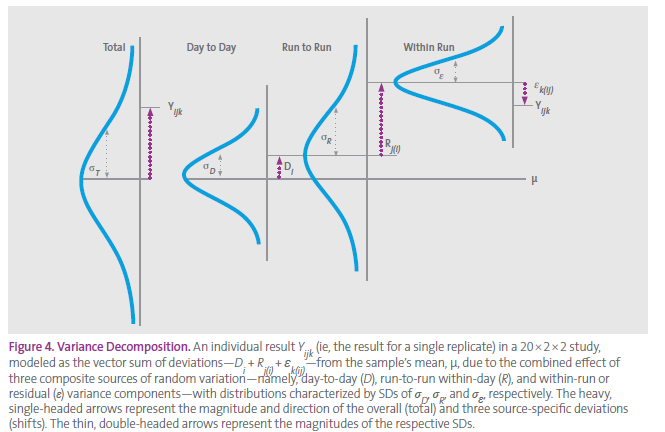
Hi, I'm following a guide on how to evaluate precision of measurements and they show this figure (image 1) for a 20x2x2 study (20 days, 2 runs each day, 2 replicates each run).

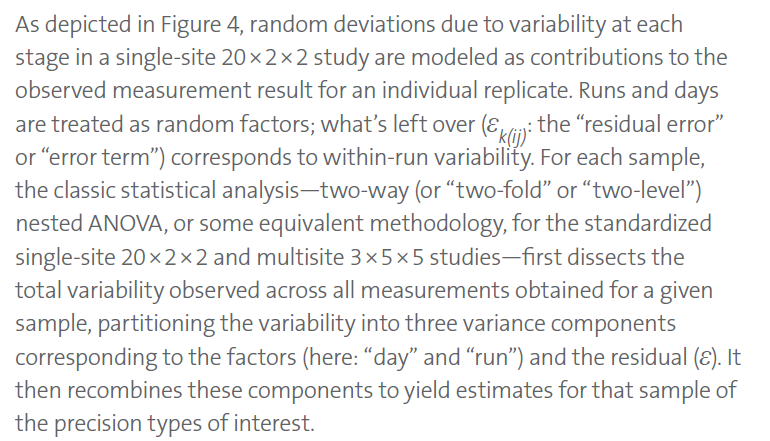
Followed by the explanation (image 2):

What is the best way to do this in JMP? Make the plot with how much of the total variance is explained by each of the variables, and also get a numerical table with this information.
Thanks
Accepted Solutions

- Mark as New
- Bookmark
- Subscribe
- Mute
- Subscribe to RSS Feed
- Get Direct Link
- Report Inappropriate Content
Re: How to implement variance decomposition
I will assume that you have a data table with a row for each measurement. There are data columns for the measurement and the grouping variables. The grouping variables are named Day (1-20), Run (1-2), and Replicate (1-2). There will be a total of 80 rows in your table.
There are a couple of platforms that can compute the variance components for you. Both of them will give you the estimates but each offers unique additional information about the estimates and about the assumptions of the model. We will start with the Fit Least Squares platform.
- Select Analyze > Fit Model.
- Select Measurement and click Y.
- Select Day and Run in the list of columns on the left.
- Click Add.
- Select Day in the list of columns and select Run in the list of effects.
- Click Nest.
- Select Day and Run[Day] in the list of effects.
- Click the red triangle next to Attributes and select Random Effect.
- Check your dialog against the picture below and when they agree, click Run.

The variance components are found in the Var Component column in the REML Variance Component Estimates report in the Fit Least Squares window.

The variability chart is another good way to get the estimates.
- Select Analyze > Quality and Process > Variability / Attribute Gauge Chart.
- Select Measurement and click Y, Response.
- Select Day and Run and click X, Grouping.
- Click Decide Later and select Nested for Model Type.
- Check that you dialog agrees with the picture below and click OK.
- Click the red triangle next to Variability Gauge and select Variance Components.
- Click OK.


The results from the two platforms differ. First, the model in the Variability Gauge platform includes an interaction term that is not part of the model used in the Fit Least Squares platform. Second, the estimation method is different. The first platform used REML and the second platform used a Bayesian technique. The reason is that the Day and Run variances are 0 in my simulated measurements, so the estimates can vary about 0. The first platform allows for negative estimates but you can change that behavior. The second platform detects the negative estimate and switches methods to give only positive estimates, but you can change that behavior.
- Mark as New
- Bookmark
- Subscribe
- Mute
- Subscribe to RSS Feed
- Get Direct Link
- Report Inappropriate Content
Re: How to implement variance decomposition
I will assume that you have a data table with a row for each measurement. There are data columns for the measurement and the grouping variables. The grouping variables are named Day (1-20), Run (1-2), and Replicate (1-2). There will be a total of 80 rows in your table.
There are a couple of platforms that can compute the variance components for you. Both of them will give you the estimates but each offers unique additional information about the estimates and about the assumptions of the model. We will start with the Fit Least Squares platform.
- Select Analyze > Fit Model.
- Select Measurement and click Y.
- Select Day and Run in the list of columns on the left.
- Click Add.
- Select Day in the list of columns and select Run in the list of effects.
- Click Nest.
- Select Day and Run[Day] in the list of effects.
- Click the red triangle next to Attributes and select Random Effect.
- Check your dialog against the picture below and when they agree, click Run.
The variance components are found in the Var Component column in the REML Variance Component Estimates report in the Fit Least Squares window.
The variability chart is another good way to get the estimates.
- Select Analyze > Quality and Process > Variability / Attribute Gauge Chart.
- Select Measurement and click Y, Response.
- Select Day and Run and click X, Grouping.
- Click Decide Later and select Nested for Model Type.
- Check that you dialog agrees with the picture below and click OK.
- Click the red triangle next to Variability Gauge and select Variance Components.
- Click OK.
The results from the two platforms differ. First, the model in the Variability Gauge platform includes an interaction term that is not part of the model used in the Fit Least Squares platform. Second, the estimation method is different. The first platform used REML and the second platform used a Bayesian technique. The reason is that the Day and Run variances are 0 in my simulated measurements, so the estimates can vary about 0. The first platform allows for negative estimates but you can change that behavior. The second platform detects the negative estimate and switches methods to give only positive estimates, but you can change that behavior.
- Mark as New
- Bookmark
- Subscribe
- Mute
- Subscribe to RSS Feed
- Get Direct Link
- Report Inappropriate Content
Re: How to implement variance decomposition
Although I don't understand why I have to choose nested, I assumed day and run were crossed? For every day you have run 1 and 2?
Thank you
- Mark as New
- Bookmark
- Subscribe
- Mute
- Subscribe to RSS Feed
- Get Direct Link
- Report Inappropriate Content
Re: How to implement variance decomposition
It has to do with the modeling and the correct computation of the variance components. It has to do with the meaning of SAME thing. You label Run as 1 and 2 for every day, but the run changes from day to day. Run 1 on Day 3 is not the same as Run 1 on Day 1. If they were crossed, you would be able to bring the SAME run to every day, which is physically impossible. Another way to think about it is in terms of the degrees of freedom. If you used a cross design, then you would have only 2 degrees of freedom for Run. But you have 20x2 = 40 degrees of freedom for Run. That is because Run is nested in Day.
Think of it this way. What if the factor was Sample = 1 or 2 to be tested on Day = 1 to 20. If the same sample were tested each day, then it is a crossed design. If the two samples were different each day, then the design is nested.
- Mark as New
- Bookmark
- Subscribe
- Mute
- Subscribe to RSS Feed
- Get Direct Link
- Report Inappropriate Content
Re: How to implement variance decomposition
Is there an easy way to determine whether the factors are nested or crossed, especially if I'm thinking of more than 2 factors?
- Mark as New
- Bookmark
- Subscribe
- Mute
- Subscribe to RSS Feed
- Get Direct Link
- Report Inappropriate Content
Re: How to implement variance decomposition
I don't know of an 'easy' way. It is a very common point of confusion, so do not feel bad if it is not entirely clear yet. I will say, though, that once you 'get it,' it will be very clear to you.
If it was always Operator Bob or Alice every day, the Operator is crossed. But if it was different operators each day and you merely called them Bob and Alice, then it is nested. It is not what you call it, it is what it is!
Here is a link to a good source (of many!) to hopefully clarify crossed and nested factors.
- Mark as New
- Bookmark
- Subscribe
- Mute
- Subscribe to RSS Feed
- Get Direct Link
- Report Inappropriate Content
Re: How to implement variance decomposition

- Mark as New
- Bookmark
- Subscribe
- Mute
- Subscribe to RSS Feed
- Get Direct Link
- Report Inappropriate Content
Re: How to implement variance decomposition
To add to @Mark_Bailey 's comments, I will say sometimes it is obvious and sometimes not. Here is a simple diagram that shows the continuum between nested and crossed with systematic in the middle. For systematic sampling, you will find different opinions as to how this should be handled.


- Mark as New
- Bookmark
- Subscribe
- Mute
- Subscribe to RSS Feed
- Get Direct Link
- Report Inappropriate Content
Re: How to implement variance decomposition
To supplement @Mark_Bailey 's recommendations, here is a JMP On Demand webinar on the very topic of interest here, hosted by my former colleague @JerryFish :
Recommended Articles
- © 2026 JMP Statistical Discovery LLC. All Rights Reserved.
- Terms of Use
- Privacy Statement
- Contact Us