- Don’t miss your chance to experience Discovery Summit Europe at our best available rate! Early bird registration through 31 Oct.
- Graph Builder Toolbar streamlines interactive graphing. Creates shortcuts on Report and GraphBuilder Helpers toolbars. Download and install the extension.
- Subscribe to RSS Feed
- Mark Topic as New
- Mark Topic as Read
- Float this Topic for Current User
- Bookmark
- Subscribe
- Mute
- Printer Friendly Page
Discussions
Solve problems, and share tips and tricks with other JMP users.- User Community
- :
- Discussions
- :
- Re: How to get only "Cp" value for a column in a Datatable?

- Mark as New
- Bookmark
- Subscribe
- Mute
- Subscribe to RSS Feed
- Get Direct Link
- Report Inappropriate Content
How to get only "Cp" value for a column in a Datatable?
Hi,
I would like to get Cp value for a column in my data table to use it in multiple script location to tabulate it. With the available function "obj << Process Capability( LSL( 5 ), Target( 40 ), USL( 75 ) );" it is clear that we can get all process capability parameters in a plot. However i would like to get Cp value for a column and assign it to a variable in my script to use it in multiple script location.
Accepted Solutions


- Mark as New
- Bookmark
- Subscribe
- Mute
- Subscribe to RSS Feed
- Get Direct Link
- Report Inappropriate Content
Re: How to get only "Cp" value for a column in a Datatable?
This little script will return the Cp for column PM10 in the Cities sample data table. It runs the Distribution platform and strips off the calculated Cp.
Names Default To Here( 1 );
dt = Open( "$SAMPLE_DATA/Cities.jmp" );
obj = dt << Distribution( invisible, Column( :PM10 ) );
obj << Process Capability( LSL( 5 ), Target( 40 ), USL( 75 ) );
cp = (Report( obj )["Within Sigma Capability"][Number Col Box( 1 )] << get)[4];
Report( obj ) << close window;
Show( cp );
cp = 1.10998512783867;

- Mark as New
- Bookmark
- Subscribe
- Mute
- Subscribe to RSS Feed
- Get Direct Link
- Report Inappropriate Content
Re: How to get only "Cp" value for a column in a Datatable?
Run the platform once, right click on correct table and choose make into datatable, check out result tables table script and finally get value from the result table. From these steps you can build the script and modify it as needed. Below is one example, built using scripting index example and make into datatable's table script (and couple of my own modifications):
Names Default To Here(1);
dt = Open("$SAMPLE_DATA/Cities.jmp");
dist = dt << Distribution(Column(:PM10), invisible);
dist << Process Capability(LSL(5), Target(40), USL(75));

dt_result = Report(dist)[Outline Box("Distributions")][Outline Box("PM10")][Outline Box("Process Capability")][Outline Box("PM10 Capability")][
Outline Box("Within Sigma Capability")][Table Box(1)] << Make Into Data Table(invisible);
Report(dist) << Close Window;

cp_idx = Loc(dt_result[0, "Index"], "Cp")[1];
cp_value = Column(dt_result, "Estimate")[cp_idx];
Show(cp_value);
Close(dt_result, no save);- Mark as New
- Bookmark
- Subscribe
- Mute
- Subscribe to RSS Feed
- Get Direct Link
- Report Inappropriate Content
Re: How to get only "Cp" value for a column in a Datatable?
This little script will return the Cp for column PM10 in the Cities sample data table. It runs the Distribution platform and strips off the calculated Cp.
Names Default To Here( 1 );
dt = Open( "$SAMPLE_DATA/Cities.jmp" );
obj = dt << Distribution( invisible, Column( :PM10 ) );
obj << Process Capability( LSL( 5 ), Target( 40 ), USL( 75 ) );
cp = (Report( obj )["Within Sigma Capability"][Number Col Box( 1 )] << get)[4];
Report( obj ) << close window;
Show( cp );
cp = 1.10998512783867;
- Mark as New
- Bookmark
- Subscribe
- Mute
- Subscribe to RSS Feed
- Get Direct Link
- Report Inappropriate Content
Re: How to get only "Cp" value for a column in a Datatable?
Thank you Jim !!
- Mark as New
- Bookmark
- Subscribe
- Mute
- Subscribe to RSS Feed
- Get Direct Link
- Report Inappropriate Content
Re: How to get only "Cp" value for a column in a Datatable?
Hi jim,
the code line, "Report(obj)["Within Sigma Capability"][Number Col Box(1)] << get" gives a list with computed process capability values in it. For one of my columns i got a list as {2.63751784878085, 2.63751784878085, 9.87329594422553, 6.25540689650319, 0.123458095613797}; Is it possible to tell in which order( along with their their names) the process capability values present in it, as i would like to access Cpk value too?
Thank you !!
- Mark as New
- Bookmark
- Subscribe
- Mute
- Subscribe to RSS Feed
- Get Direct Link
- Report Inappropriate Content
Re: How to get only "Cp" value for a column in a Datatable?
I would save the values into Associative array unless it is necessary to know the indices. Associative array will be sorted but you can access the values with key value:
aa_capability = Associative Array(
	(Report(obj)["Within Sigma Capability"][String Col Box(1)] << get),
	(Report(obj)["Within Sigma Capability"][Number Col Box(1)] << get)
);
show(aa_capability);
show(aa_capability["Cp"]);- Mark as New
- Bookmark
- Subscribe
- Mute
- Subscribe to RSS Feed
- Get Direct Link
- Report Inappropriate Content
Re: How to get only "Cp" value for a column in a Datatable?
Thanks Jarmo !! It made the process easy to access by their names !!
As i was not fully aware of the Associative Array i couldn't help myself.
Mentioned snippet returned the following output of the Associative Array:
show(aa_capability);
show(aa_capability["Cp"]);
aa_capability = ["Cp" => 2.68240606599007, "Cpk" => 1.19967417960853, "Cpl" => 1.19967417960853, "Cpm" => 0.742413736498107, "Cpu" => 4.16513795237162]; aa_capability["Cp"] = 2.68240606599007;
- Mark as New
- Bookmark
- Subscribe
- Mute
- Subscribe to RSS Feed
- Get Direct Link
- Report Inappropriate Content
Re: How to get only "Cp" value for a column in a Datatable?
For associative arrays I suggest reading Associative Arrays (jmp.com) to learn more about associative arrays.
Couple important things from the first page of the Associative Arrays in jmp.com:
An associative array maps unique keys to values that can be non-unique
The value associated with a key can be a number, date, matrix, list, and so on.
Though associative arrays are not usually ordered, in JMP, keys are returned in alphanumeric order for the purpose of iteration and serialization.
Rest of the pages can be found from the panel on left:
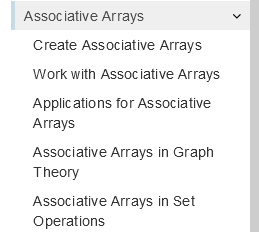
You can also move to next page from the > on top right corner of the page:
- Mark as New
- Bookmark
- Subscribe
- Mute
- Subscribe to RSS Feed
- Get Direct Link
- Report Inappropriate Content
Re: How to get only "Cp" value for a column in a Datatable?
Run the platform once, right click on correct table and choose make into datatable, check out result tables table script and finally get value from the result table. From these steps you can build the script and modify it as needed. Below is one example, built using scripting index example and make into datatable's table script (and couple of my own modifications):
Names Default To Here(1);
dt = Open("$SAMPLE_DATA/Cities.jmp");
dist = dt << Distribution(Column(:PM10), invisible);
dist << Process Capability(LSL(5), Target(40), USL(75));

dt_result = Report(dist)[Outline Box("Distributions")][Outline Box("PM10")][Outline Box("Process Capability")][Outline Box("PM10 Capability")][
Outline Box("Within Sigma Capability")][Table Box(1)] << Make Into Data Table(invisible);
Report(dist) << Close Window;

cp_idx = Loc(dt_result[0, "Index"], "Cp")[1];
cp_value = Column(dt_result, "Estimate")[cp_idx];
Show(cp_value);
Close(dt_result, no save);- Mark as New
- Bookmark
- Subscribe
- Mute
- Subscribe to RSS Feed
- Get Direct Link
- Report Inappropriate Content
Re: How to get only "Cp" value for a column in a Datatable?
Thanks Jarmo !!
Recommended Articles
- © 2026 JMP Statistical Discovery LLC. All Rights Reserved.
- Terms of Use
- Privacy Statement
- Contact Us