- JMP will suspend normal business operations for our Winter Holiday beginning on Wednesday, Dec. 24, 2025, at 5:00 p.m. ET (2:00 p.m. ET for JMP Accounts Receivable).
Regular business hours will resume at 9:00 a.m. EST on Friday, Jan. 2, 2026. - We’re retiring the File Exchange at the end of this year. The JMP Marketplace is now your destination for add-ins and extensions.
- Subscribe to RSS Feed
- Mark Topic as New
- Mark Topic as Read
- Float this Topic for Current User
- Bookmark
- Subscribe
- Mute
- Printer Friendly Page
Discussions
Solve problems, and share tips and tricks with other JMP users.- JMP User Community
- :
- Discussions
- :
- Re: How to force heatmap to show all rows/columns even when empty?
- Mark as New
- Bookmark
- Subscribe
- Mute
- Subscribe to RSS Feed
- Get Direct Link
- Report Inappropriate Content
How to force heatmap to show all rows/columns even when empty?
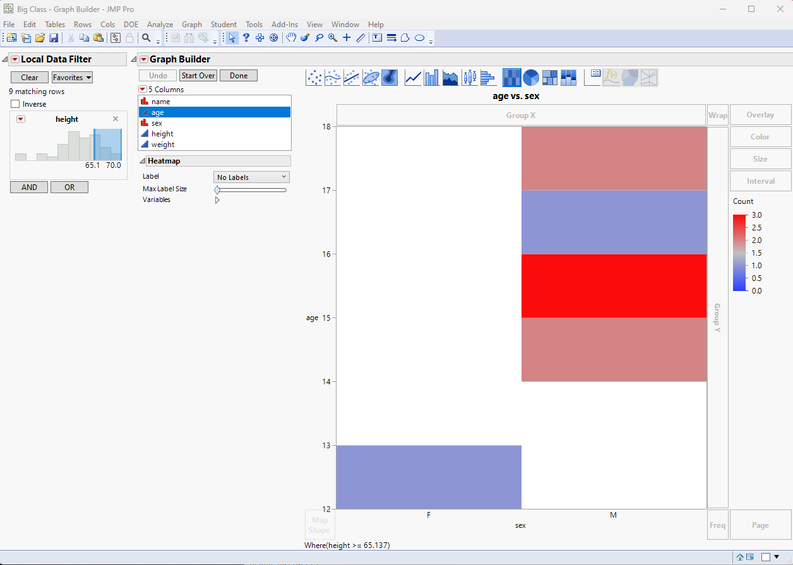
Is there a trick to making a heatmap show all rows even when a data filter eliminates some of them?
Consider this plot created against "Big Class.jmp":
Graph Builder(
	Size( 673, 714 ),
	Variables( X( :sex ), Y( :age ) ),
	Elements( Heatmap( X, Y, Legend( 2 ) ) ),
	Local Data Filter(
		Add Filter( columns( :height ), Where( :height >= 65.137 & :height <= 70 ) )
	)
)
If you look at this plot, you see that the row for age 13 is completely missing. I realize that the local data filter removed all entries for age 13, but is there a good way to make the row for 13 still show up, i.e. as an all-white row.
Accepted Solutions
- Mark as New
- Bookmark
- Subscribe
- Mute
- Subscribe to RSS Feed
- Get Direct Link
- Report Inappropriate Content
Re: How to force heatmap to show all rows/columns even when empty?
Sometimes enabling Show Excluded Rows might also work. To enable Show Excluded Rows, hold shift when you click the red triangle
but this can end up showing some rows which you might not want to see (you could have excluded rows from the data table for example).
Names Default To Here(1);

dt = Open("$SAMPLE_DATA/Big Class.jmp");

gb = dt << Graph Builder(
	Size(626, 662),
	Show Control Panel(0),
	Ignore Platform Preferences(1),
	Show Excluded Rows(1),
	Variables(X(:sex), Y(:age)),
	Elements(Heatmap(X, Y, Legend(2))),
	Local Data Filter(Add Filter(columns(:height), Where(:height >= 65.137)))
);
Depending on your data Shape Files can be a good idea like Jim did already suggest.
- Mark as New
- Bookmark
- Subscribe
- Mute
- Subscribe to RSS Feed
- Get Direct Link
- Report Inappropriate Content
Re: How to force heatmap to show all rows/columns even when empty?
Change the Age column from Ordinal to Continuous and you will get the complete Y axis you want
- Mark as New
- Bookmark
- Subscribe
- Mute
- Subscribe to RSS Feed
- Get Direct Link
- Report Inappropriate Content
Re: How to force heatmap to show all rows/columns even when empty?
Sadly in our case that variable truly is nominal, so that won't work for our specific problem.
- Mark as New
- Bookmark
- Subscribe
- Mute
- Subscribe to RSS Feed
- Get Direct Link
- Report Inappropriate Content
Re: How to force heatmap to show all rows/columns even when empty?
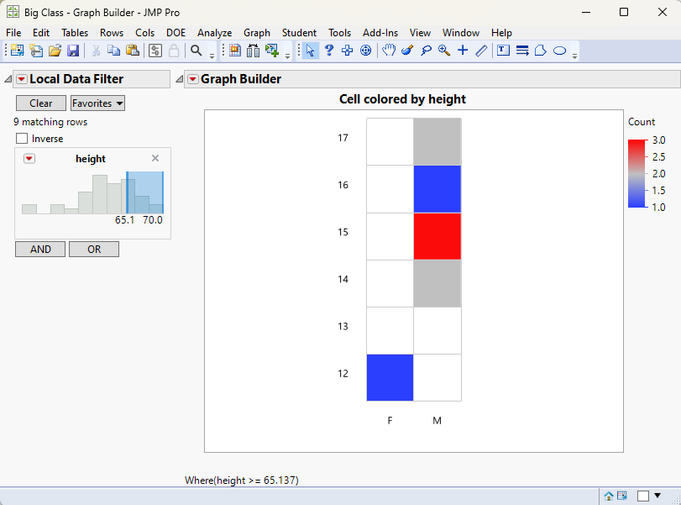
You can create a simple Shape map that contains all of the categories, and then drag your count column onto the map, and it will display a choropleth map, which is a heat map. You will have to create a new column which is a combination of your current X and Y variables, which will point to the specific element in the map, but it will do what you want.
- Mark as New
- Bookmark
- Subscribe
- Mute
- Subscribe to RSS Feed
- Get Direct Link
- Report Inappropriate Content
Re: How to force heatmap to show all rows/columns even when empty?
This sounds like it could work. I read the docs on Shape maps, but I'm not sure I'm understanding them. How do I make the map you're describing? And how do I load it?
- Mark as New
- Bookmark
- Subscribe
- Mute
- Subscribe to RSS Feed
- Get Direct Link
- Report Inappropriate Content
Re: How to force heatmap to show all rows/columns even when empty?
The maps can be Saved into
C:\Users\<user name>\AppData\Roaming\SAS\JMP\Maps
or, they can be saved into $TEMP and then referenced by passing the location to Graph Builder. I took the time to expand your example into a script that creates the Shape Map file, and saves them to $TEMP and finally graphs the data
Names Default To Here( 1 );

dt =
// Open Data Table: Big Class.jmp
// → Data Table( "Big Class" )
Open( "$SAMPLE_DATA/Big Class.jmp" );


// Create the Shape Map tables
dtXY = New Table( "Class-XY",
	New Column( "Shape", modeling type( Ordinal ) ),
	New Column( "Part", Modeling type( Ordinal ) ),
	New Column( "X" ),
	New Column( "Y" )
);

dtName = New Table( "Class-Name",
	New Column( "Shape", Modeling type( Ordinal ) ),
	New Column( "Cell", character )
);
dtName:Cell << set property( "Map Role", Map Role( Shape Name Definition ) );

// Populate the tables
ages = Associative Array( dt:Age << get values ) << get keys;
sexes = Associative Array( dt:Sex << get values ) << get keys;
ID = 0;
For Each( {sex, xi}, sexes,
	For Each( {age, yi}, ages,
		theName = Char( sex ) || Char( age );show(thename);
		ID++;
		dtName << add rows( 1 );
		dtName:Shape[N Rows( dtName )] = ID;
		dtName:Cell[N Rows( dtName )] = theName;
		dtXY << add rows( 1 );
		dtXY:Shape[N Rows( dtXY )] = ID;
		dtXY:Part[N Rows( dtXY )] = ID;
		dtXY:X[N Rows( dtXY )] = xi;
		dtXY:Y[N Rows( dtXY )] = yi;
		dtXY << add rows( 1 );
		dtXY:Shape[N Rows( dtXY )] = ID;
		dtXY:Part[N Rows( dtXY )] = ID;
		dtXY:X[N Rows( dtXY )] = xi;
		dtXY:Y[N Rows( dtXY )] = yi + 1;
		dtXY << add rows( 1 );
		dtXY:Shape[N Rows( dtXY )] = ID;
		dtXY:Part[N Rows( dtXY )] = ID;
		dtXY:X[N Rows( dtXY )] = xi + 1;
		dtXY:Y[N Rows( dtXY )] = yi + 1;
		dtXY << add rows( 1 );
		dtXY:Shape[N Rows( dtXY )] = ID;
		dtXY:Part[N Rows( dtXY )] = ID;
		dtXY:X[N Rows( dtXY )] = xi + 1;
		dtXY:Y[N Rows( dtXY )] = yi;
	)
);

// Save the Map tables to the Temp Directory
close( dtXY, Save( "$temp\mycell-XY.jmp" ));
close( dtName, Save( "$temp\mycell-Name.jmp") );

// Add the concatenated Sex/Age column to the data table
dt << New Column( "Cell", character, set each value( :Sex || Char(:Age)));

// Create the Heat map using the Shape Map
gb = Graph Builder(
	Size( 522, 456 ),
	Show Control Panel( 0 ),
	Variables(
		Color( :height ),
		Shape(
			:Cell,
			Set Shape File( "$TEMP/mycell-Name.jmp" )
		)
	),
	Elements(
		Map Shapes(
			Legend( 3 ),
			Summary Statistic( "N" ),
			Show Missing Shapes( 1 )
		)
	),
	Local Data Filter(
		Add Filter( columns( :height ), Where( :height >= 65.137 ) )
	),
	SendToReport(
		Dispatch(
			{},
			"",
			ScaleBox,
			{Format( "Fixed Dec", 12, 0 ), Min( -2.44489795918367 ),
			Max( 6.44489795918367 ), Inc( 1 ), Minor Ticks( 0 ),
			Label Row(
				{Automatic Font Size( 0 ), Automatic Tick Marks( 0 ),
				Show Major Labels( 0 ), Show Major Ticks( 0 ), Show Minor Ticks( 0 )
				}
			)}
		),
		Dispatch(
			{},
			"",
			ScaleBox( 2 ),
			{Min( -0.0843053453846471 ), Max( 7.18430534538465 ), Inc( 1 ),
			Minor Ticks( 0 ), Label Row(
				{Automatic Font Size( 0 ), Automatic Tick Marks( 0 ),
				Show Major Labels( 0 ), Show Major Ticks( 0 ), Show Minor Ticks( 0 )
				}
			)}
		),
		Dispatch( {}, "400", LegendBox, {Set Title( "Count" )} )
	)
);

// Add the cell labelling to the graph

Report( gb )[FrameBox( 1 )] << Add Graphics script(
	For Each( {sex, xi}, sexes,
		Eval( Eval Expr( Text( Center Justified, {Expr( xi + .5 ), .5}, Expr( sex ) ) ) )
	);
	For Each( {age, yi}, ages,
		Eval( Eval Expr( Text( Center Justified, {.5,Expr( yi + .5 ) }, Expr( char(age) ) ) ) )
	);
);
- Mark as New
- Bookmark
- Subscribe
- Mute
- Subscribe to RSS Feed
- Get Direct Link
- Report Inappropriate Content
Re: How to force heatmap to show all rows/columns even when empty?
Sometimes enabling Show Excluded Rows might also work. To enable Show Excluded Rows, hold shift when you click the red triangle
but this can end up showing some rows which you might not want to see (you could have excluded rows from the data table for example).
Names Default To Here(1);

dt = Open("$SAMPLE_DATA/Big Class.jmp");

gb = dt << Graph Builder(
	Size(626, 662),
	Show Control Panel(0),
	Ignore Platform Preferences(1),
	Show Excluded Rows(1),
	Variables(X(:sex), Y(:age)),
	Elements(Heatmap(X, Y, Legend(2))),
	Local Data Filter(Add Filter(columns(:height), Where(:height >= 65.137)))
);
Depending on your data Shape Files can be a good idea like Jim did already suggest.
- Mark as New
- Bookmark
- Subscribe
- Mute
- Subscribe to RSS Feed
- Get Direct Link
- Report Inappropriate Content
Re: How to force heatmap to show all rows/columns even when empty?
Jarmo,
Your response is clearly a better choice, however, the interactive selection of
Show Excluded Rows
does not appear as an option on my list of selections
The option does appear in my preferences. Have you any idea what the issue is?
- Mark as New
- Bookmark
- Subscribe
- Mute
- Subscribe to RSS Feed
- Get Direct Link
- Report Inappropriate Content
Re: How to force heatmap to show all rows/columns even when empty?
You have to be holding down SHIFT when you click on the red triangle menu (JMP does have few of these "hidden" features in red triangle menus). I have learned about it in some post by Julian such as this https://community.jmp.com/t5/Discussions/Exclude-and-Show-Data-in-Fit-Y-by-X-and-Graph-Builder/m-p/5...
Plot Excluded and Unhidden data points in Graph Builder
Recommended Articles
- © 2025 JMP Statistical Discovery LLC. All Rights Reserved.
- Terms of Use
- Privacy Statement
- Contact Us


