cancel
Showing results for 
Show  only  | Search instead for 
Did you mean: 
  • DownloadSemiconductor Toolkit: Tools to create wafer maps, add wafer geometry to graphics, explore die defects & compare wafers.
  • Discovery Summit 2026: Early User Edition - September 23-24.Register. It's free.
  • Use JMP Clinical with CDISC-compliant data. Review studies, ID safety and efficacy signals & communicate findings with interactive graphics. Register to see how. Aug. 27, 2 pm US ET.

Discussions

Solve problems, and share tips and tricks with other JMP users.
Choose Language Hide Translation Bar

How to edit the statistics text of Graph Builder's Line of Fit

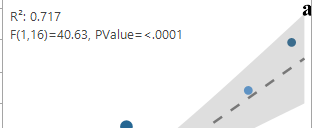
I draw regression graphs, when i add  f test report, by default "f and p" value show at the graph. but i want only p values. how can i edit


Edit (jthi): changed title from "Editing" to "How to edit the statistics text of Graph Builder's Line of Fit" to make it more descriptive of the problem


1 REPLY 1
jthi
Super User

Re: Editing

I think you have to use some scripting Formatting elements in Graph Builder. You will have to modify the logic of building the text but you can get something like this

jthi_0-1768559095342.png

jthi_1-1768559101763.png


-Jarmo

Recommended Articles