- New to JMP? Join us Sept. 23-24 for the Early User Edition of Discovery Summit, tailor-made for new users. Register now for free!
- Your voice matters! Tell us how you prefer to receive JMP updates, so we can tailor our communication to your needs. Take short survey.
- See how to access JMP Marketplace - and - find, create & share add-ins to extend your JMP. Watch video.
- Subscribe to RSS Feed
- Mark Topic as New
- Mark Topic as Read
- Float this Topic for Current User
- Bookmark
- Subscribe
- Mute
- Printer Friendly Page
Discussions
Solve problems, and share tips and tricks with other JMP users.- JMP User Community
- :
- Discussions
- :
- Re: How to display baseline/reference data in many sub graphs using the graph bu...

- Mark as New
- Bookmark
- Subscribe
- Mute
- Subscribe to RSS Feed
- Get Direct Link
- Report Inappropriate Content
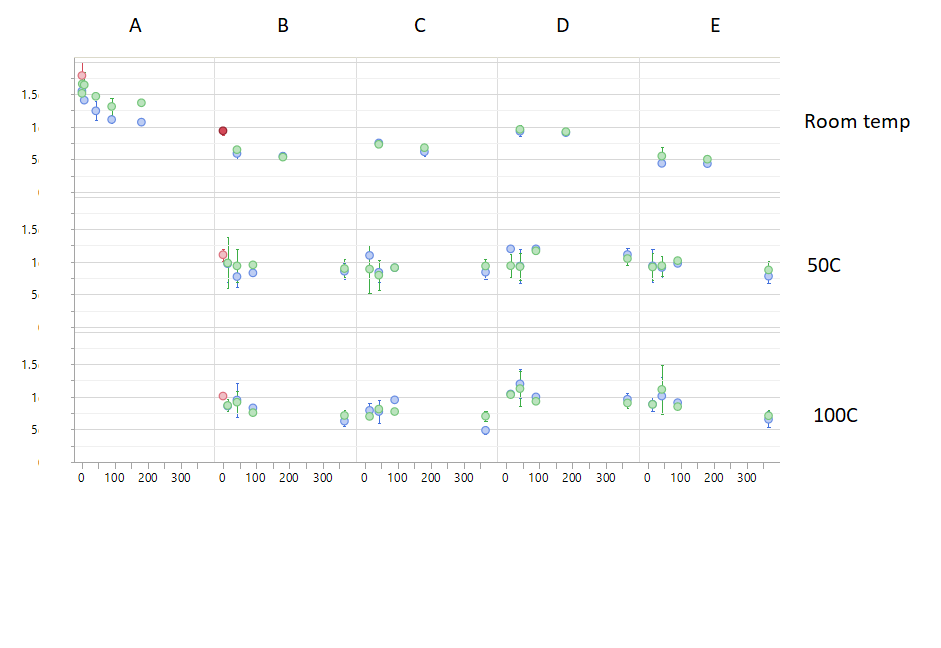
How to display baseline/reference data in many sub graphs using the graph builder
Hi, I have some trouble with displaying baseline/reference values in my graphs using the graph builder.
For many of my experiments I first take some samples before the actual start of the experimental conditions.
The data from these samples can thus be considered as baseline/reference/T=0 data.
They always have a value of 0 on the x-axis of.
Examples of such data are depicted in red in the attached example graphs.
These baseline values are considered to be valid for multiple conditions (sometimes all conditions in the entire graph, sometimes just a few).
I would like to have this baseline/reference/T=0 data also appear in the other sub graphs, for example the red data in the top row of column B should also appear in columns C-E of the top row for easier comparisons.
One way to do this is by copying the frame contents of a sub graph which only as this specific data into the sub graphs that also need to include this.
However, if I do it this way the data points are in the graph, but are not part of the rest of the data, that is: the datapoints will not be used in any linear regression plots or other types of line fitting.
Another way to accomplish this would be to simply clone the data rows that correspond to my baseline values and make sure that they match all the different conditions of the sub graphs (e.g. I clone the data from column B top row 3 times and assign conditions C,D and E to the cloned data).
However, this method is very error prone: if I later on decide to split my graphs differently (for example have the graphs from all column B rows grouped in a single graph) I might end up with too many of my baseline cloned values.
Is there a way to assign some data rows as an x=o/baseline value that can be used in graphs without exactly matching all the conditions of a sub graph?
Any other ideas/tips on accomplishing my needs are of course also very welcome!
Accepted Solutions

- Mark as New
- Bookmark
- Subscribe
- Mute
- Subscribe to RSS Feed
- Get Direct Link
- Report Inappropriate Content
Re: How to display baseline/reference data in many sub graphs using the graph builder
- Mark as New
- Bookmark
- Subscribe
- Mute
- Subscribe to RSS Feed
- Get Direct Link
- Report Inappropriate Content
Re: How to display baseline/reference data in many sub graphs using the graph builder
My suggestion is that you add a graphics script to the 4 Frame Box()s you want the data points to be in.

Here is the simple script that created the dots.......the majority of the script is creating the sample data table. Just the last few lines is the actual script
Names Default to here(1);
dt = New Table( "Example",
	Add Rows( 67 ),
	New Column( "Group",
		Character,
		"Nominal",
		Set Values(
			{"A", "A", "A", "A", "A", "A", "A", "B", "B", "B", "B", "B", "B", "B",
			"B", "B", "B", "B", "B", "B", "B", "B", "C", "C", "C", "C", "C", "C",
			"C", "C", "C", "C", "C", "C", "C", "C", "C", "D", "D", "D", "D", "D",
			"D", "D", "D", "D", "D", "D", "D", "D", "D", "D", "E", "E", "E", "E",
			"E", "E", "E", "E", "E", "E", "E", "E", "E", "E", "E"}
		)
	),
	New Column( "Temperature",
		Character,
		"Nominal",
		Set Property(
			"Value Order",
			{Custom Order( {"Room temp", "50C", "100C"} )}
		),
		Set Property( "Value Ordering", {"Room temp", "50C", "100C"} ),
		Set Selected,
		Set Values(
			{"Room temp", "Room temp", "Room temp", "Room temp", "Room temp",
			"Room temp", "Room temp", "Room temp", "Room temp", "Room temp",
			"Room temp", "Room temp", "50C", "50C", "50C", "50C", "50C", "100C",
			"100C", "100C", "100C", "100C", "Room temp", "Room temp", "Room temp",
			"Room temp", "Room temp", "50C", "50C", "50C", "50C", "50C", "100C",
			"100C", "100C", "100C", "100C", "Room temp", "Room temp", "Room temp",
			"Room temp", "Room temp", "50C", "50C", "50C", "50C", "50C", "100C",
			"100C", "100C", "100C", "100C", "Room temp", "Room temp", "Room temp",
			"Room temp", "Room temp", "50C", "50C", "50C", "50C", "50C", "100C",
			"100C", "100C", "100C", "100C"}
		),
		Set Display Width( 90 )
	),
	New Column( "X",
		Numeric,
		"Continuous",
		Format( "Fixed Dec", 6, 2 ),
		Set Values(
			[258.086397405714, 5.71660939604044, 264.575294405222, 3.84040102362633,
			111.404376197606, 133.551742043346, 91.8762267567217, 189.603863935918,
			307.007787004113, 376.469777431339, 58.0949549563229, 351.253207586706,
			226.566027104855, 188.892256747931, 348.487993236631, 252.905753627419,
			1.70303797349334, 227.671681251377, 338.782033976167, 76.001576334238,
			234.24083692953, 211.666149552911, 265.708565711975, 362.39934200421,
			234.673242177814, 212.324240896851, 383.057508058846, 195.605019852519,
			61.6203579120338, 71.0408803075552, 27.8500666841865, 310.922908596694,
			61.4271127618849, 82.9685751348734, 300.162270013243, 298.373543936759,
			200.286800507456, 359.332282561809, 333.920630905777, 359.006200451404,
			269.942311383784, 294.209049642086, 277.116103097796, 245.826263446361,
			135.435333196074, 2.35101021826267, 47.5669040344655, 64.5015124231577,
			14.7597001865506, 166.282143630087, 41.0635557956994, 372.02960383147,
			141.542105656117, 245.253551751375, 20.4098232090473, 308.782488573343,
			320.178817585111, 385.662938468158, 94.0748155117035, 210.638642776757,
			166.42337795347, 71.8085302971303, 192.030807211995, 230.266057234257,
			129.467561934143, 5.54275354370475, 8.59832679852843]
		)
	),
	New Column( "Y",
		Numeric,
		"Continuous",
		Format( "Fixed Dec", 5, 2 ),
		Set Values(
			[1.02607587021776, 0.653618767019361, 1.53731636162847,
			0.729673718311824, 1.49533799653873, 1.23533858652227, 0.849716614512727,
			0.581313263415359, 0.606830982468091, 0.639017060375772,
			0.66028903669212, 1.73605558376294, 1.4746200523572, 0.556068896036595,
			1.23279224487487, 1.34703196317423, 0.989429965941235, 1.79481856492348,
			1.23647878237534, 1.48463883153163, 1.29623788862955, 1.47248895687517,
			1.7227064746432, 0.908843804872595, 1.75762778942008, 1.77237830588128,
			1.39678464503959, 0.738564432132989, 0.937373555754311,
			0.859008972067386, 1.26195742939599, 0.837709486694075, 1.59947897703387,
			1.57057911711745, 0.760114008234814, 0.552464534901083, 1.4807414769195,
			1.25857475702651, 1.63368526850827, 1.07403574278578, 0.986908302386291,
			1.61206896633375, 1.43845481819008, 0.701383810932748, 0.837472997186706,
			0.582971931062639, 1.21421920987777, 1.23774031742942, 1.56993834450841,
			0.546321215387434, 1.07465963645373, 0.828954836539924, 1.12470607999712,
			1.7027954606805, 1.33964142960031, 1.39873550860211, 0.556500582862645,
			1.49248978442047, 0.524437115713954, 1.76477531134151, 0.674911431502551,
			1.11191339418292, 1.07515239135828, 1.30424426791724, 1.40288751532789,
			1.25682635509875, 0.69936976779718]
		)
	)
);

// Run the graph
gb = Graph Builder(
	Variables( X( :X ), Y( :Y ), Group X( :Group ), Group Y( :Temperature ) ),
	Elements( Points( X, Y, Legend( 7 ) ) )
);
// Add the dots
Report( gb )[FrameBox( 4 )] << Add Graphics Script(
	Fill Color( "red" );
	Circle( {0, 1.8}, PixelRadius( 3 ), "FILL" );
);
Report( gb )[FrameBox( 7 )] << Add Graphics Script(
	Fill Color( "red" );
	Circle( {0, 1.8}, PixelRadius( 3 ), "FILL" );
);
Report( gb )[FrameBox( 10 )] << Add Graphics Script(
	Fill Color( "red" );
	Circle( {0, 1.8}, PixelRadius( 3 ), "FILL" );
);
Report( gb )[FrameBox( 13 )] << Add Graphics Script(
	Fill Color( "red" );
	Circle( {0, 1.8}, PixelRadius( 3 ), "FILL" );
);
- Mark as New
- Bookmark
- Subscribe
- Mute
- Subscribe to RSS Feed
- Get Direct Link
- Report Inappropriate Content
Re: How to display baseline/reference data in many sub graphs using the graph builder
Thank you for the elaborate help on this Jim!
The script runs fine and indeed plots the wanted values in the other frame boxes.
However, the data points are simply displayed/plotted next to the other data points already in the frame box.
My specific wish/need is to be able to let them be part of the actual data so that they can be included in for example line regression fitting.
One of the solutions to this problem that I mentioned (cloning these T=0/baseline values and ensuring they match the exact conditions of the other data in the frame box) makes these values possible to integrate in linear regression fitting.
The big problem with this method (besides feeling like an excessive approach to the problem as you often create many many extra data rows to fit all the specific combinations of conditions that you would get in bigger studies) is that you always need to be very careful that you don't end up with more than one set of the T=0 data in a subgraph;
because if you would have multiple sets of T=0 data and would do linear regression you would overestimate the precision/significance of your fit due to artificially increased sample size with an identical variance at x=o.
Hopefully this clarifies my specific needs/wishes a bit better.
If not, please let me know!
- Mark as New
- Bookmark
- Subscribe
- Mute
- Subscribe to RSS Feed
- Get Direct Link
- Report Inappropriate Content
Re: How to display baseline/reference data in many sub graphs using the graph builder
- Mark as New
- Bookmark
- Subscribe
- Mute
- Subscribe to RSS Feed
- Get Direct Link
- Report Inappropriate Content
Re: How to display baseline/reference data in many sub graphs using the graph builder
I was hoping for a more elegant solution to my issue, but cloning of the data it is then.
The tip of the extra column with clone status will help a lot indeed in keeping things organized and to prevent human mistakes!
thanks again!
Recommended Articles
- © 2026 JMP Statistical Discovery LLC. All Rights Reserved.
- Terms of Use
- Privacy Statement
- Contact Us