- Learn how to build custom Python data connectors and further customize JMP’s Data Connector Framework with the Python Data Connector Demo, available now in the JMP Marketplace!
- See how to create experiments to support product design and ID useful product features. Register for June 12 webinar, 2pm US Eastern Time.
- Subscribe to RSS Feed
- Mark Topic as New
- Mark Topic as Read
- Float this Topic for Current User
- Bookmark
- Subscribe
- Mute
- Printer Friendly Page
Discussions
Solve problems, and share tips and tricks with other JMP users.- JMP User Community
- :
- Discussions
- :
- Re: How to continue with no Analysis of Variance significance but Parameter Esti...

- Mark as New
- Bookmark
- Subscribe
- Mute
- Subscribe to RSS Feed
- Get Direct Link
- Report Inappropriate Content
How to continue with no Analysis of Variance significance but Parameter Estimates significance
[interactive explanation]
The analysis of responses with a DSD (Definitive Screening Design) resulted in no significance in the Analysis of Variance (p=0.0898) for the "Actual by Predicted Plot" report. But parameter estimates report showed significance (p=0.0321) for one factor. Similar findings are described in the example: http://www.jmp.com/support/help/Examples_of_Definitive_Screening_Designs.shtml#424359 . I oberseved this results for Least Square and stepwise personality.
ANOVA:
RSq: 0.38
RAdj: 0.25
n=13
DSD: N = 13 / no replicates / 3 Factors all continuous
Reponse: no replicates / continuous
Residues for the plot attached.
0. Is the the significance relevant even when the Anova denies it?
1. How can I continue with the analysis?
3. What specific t-test is used in the reports of the parameter estimates?
4. Are the results an indication for violation of assumptions of the tests?

- Mark as New
- Bookmark
- Subscribe
- Mute
- Subscribe to RSS Feed
- Get Direct Link
- Report Inappropriate Content
Re: How to continue with no Analysis of Variance significance but Parameter Estimates significance
First of all, all of the tests are performed correctly but they are answering different questions. So here goes with your specific questions (note that my numbering is off by 1):
- The significance of the individual parameter estimate might be correct in spite of the apparent non-significant ANOVA. The ANOVA is testing for the whole model (any effect) versus the reduced model (no effect - intercept only). In a true screening experiment there are few degrees of freedom for the denominator because you are using an economical design to test many factors. Of course, it also depends on your choice of alpha. In a true screening situation, you might use a higher alpha (accepting a higher type I error rate) in order to achieve a lower type II error rate.
- You might remove the least significant parameter (highest p-value) if it is considerably higher than the lowest p-value and you deem it truly non-significant. Iterate as such until you feel that the remaining parameters might be significant. The p-value for the ANOVA will change, too, because the whole model it is testing and the DF for error are changing with each iteration.
- The t-test for the parameters is a null hypothesis that the parameter is truly 0 (no effect) versus it is not 0 (a true effect). It is constructed in the usual way: t = (parameter estimate - hypothesized parameter) / standard error of the parameter estimate. In this case, the hypothesized parameter is 0 so the t ratio you see is simply the estimate divided by its standard error.
- These results alone are not an indication of any violation of the assumptions. You should perform an analysis of the residuals to check the assumptions of normally distributed errors with constant variance and independence.
- Mark as New
- Bookmark
- Subscribe
- Mute
- Subscribe to RSS Feed
- Get Direct Link
- Report Inappropriate Content
Re: How to continue with no Analysis of Variance significance but Parameter Estimates significance
Thank you very much markbailey for the very helpful support. Your answer really gives a big step forward. The analysis is much clearer for me.
Based on your answer: 5. Is it a problem at all that I used the DSD for a DoE of only 3 factors?
Addition to my first post: The special models for DSD evaluation gave me no significance. However, one Factor A seems to have an impact on the main effects diagramm. When excluding two factors (B+C), I receive a poor model (see first post) but a significance for Factor A.
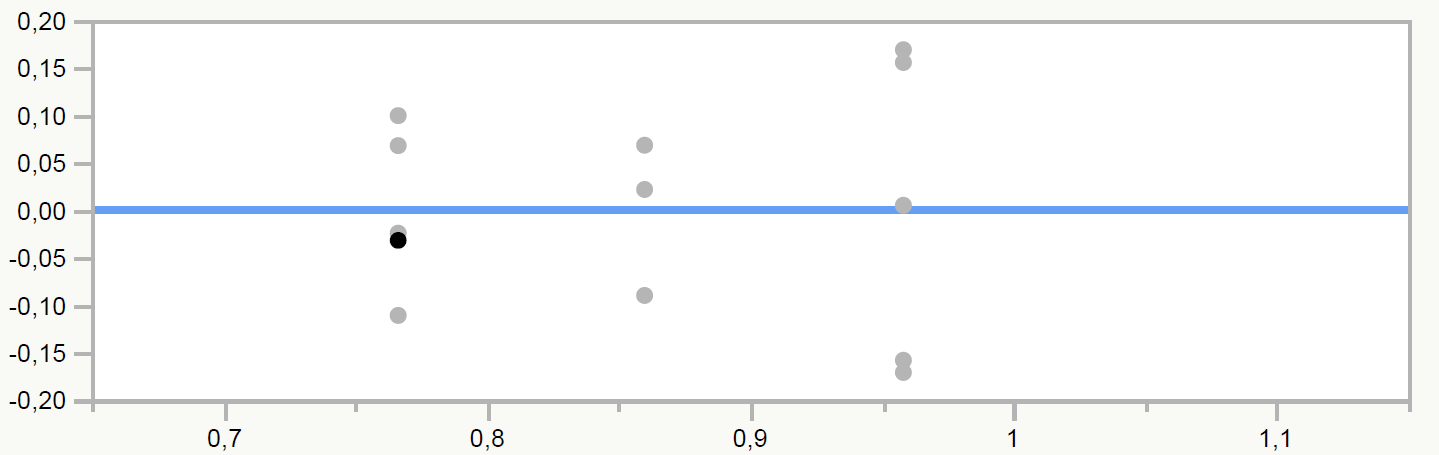
I continued my analysis, especially for the resiudes as you said. Studentized residues show no anormalities. However, I receive a strange distribution for residues "actual vs. predicted plot" as visible in the attachement.
6. Is this distribution derived from the fact that I necleget the two other factors?
7. Or is the amount of data point not suffcient to gain a normal distribution?
8. Can I conclude that the data for the model has not same variances/normal distribution?
- Mark as New
- Bookmark
- Subscribe
- Mute
- Subscribe to RSS Feed
- Get Direct Link
- Report Inappropriate Content
Re: How to continue with no Analysis of Variance significance but Parameter Estimates significance
First of all, the DSD is one of many choices for the design method. Any design method must address the same principles. Now in particular, any method for the design of a screening experiment will assume the following additional principles hold:
- Sparsity of Effects: there are many potential factors and, hence, many potential effects of those factors (main effects, interaction effects, non-linear effects in the linear model) but only a small portion will be, in fact, active.
- Hierarchy of Effects: most of the effect on the response is first order in nature, the second most effect is second order in nature, and so on. So higher order effects are usually ignored and do not need to be included in the model and, therefore, do not need to be addressed by the design of the experiment.
- Heredity of Effects: any higher order effect is associated with a factor that also has a strong first order effect.
- Projection: the elimination of the inactive factors will result in a design that is capable of fitting a higher order model for the few remaining factors.
Screening designs are intended for screening experiments where you have to determine among a large number of potential factors which ones are active. I don't consider 3 factors a large number or a true screening situation. You have a better choice for a design method than DSD for the case of 3 factors: custom design.
The DSD platform has built-in features to guard against mis-use (too few factors). It actually includes fake factors to result in a design with a larger number of runs than is strictly necessary to fit the main effects model to increase the power of the design. (The fake factor columns are stripped away before the design is presented to you.)
- Mark as New
- Bookmark
- Subscribe
- Mute
- Subscribe to RSS Feed
- Get Direct Link
- Report Inappropriate Content
Re: How to continue with no Analysis of Variance significance but Parameter Estimates significance
Your screen capture shows the Residuals by Predicted Plot, I believe, not Studentized residuals or the other plot as stated. (The axis labels were not included.) This plot exhibits no abnormalities. It exhibits high variance for the associated response range so your R square will be small and your tests will have low power.
The Actual by Predicted Plot would show bias in the model if you have lack of fit. (It should also be evident in the residual plots.) This situation might indicate that you have a non-linear effect of a continuous factor and need to add a quadratic term for this factor.
6. The distribution of the residuals is model dependent, so yes, it depends on the terms in the model. It is assumed that the residuals are estimates of the random error in the response but if there is lack of fit then they are a linear combination of the response errors and the model bias.
7. The form of the distribution (normal or other) depends on the nature of the response, an inherent quality. Linear regression assumes that the errors are normally distributed and models them with a normal distribution with a mean = 0 and constant variance. It does not depend on the number of runs in the design. There are other regression methods (e.g., generalized linear models) that can use other distribution models for the errors.
8. I don't understand this question.
Recommended Articles
- © 2026 JMP Statistical Discovery LLC. All Rights Reserved.
- Terms of Use
- Privacy Statement
- Contact Us