- Don’t miss your chance to experience Discovery Summit Europe at our best available rate! Early bird registration through 31 Oct.
- Graph Builder Toolbar streamlines interactive graphing. Creates shortcuts on Report and GraphBuilder Helpers toolbars. Download and install the extension.
- Subscribe to RSS Feed
- Mark Topic as New
- Mark Topic as Read
- Float this Topic for Current User
- Bookmark
- Subscribe
- Mute
- Printer Friendly Page
Discussions
Solve problems, and share tips and tricks with other JMP users.- User Community
- :
- Discussions
- :
- Re: How to configure the axis to make the grid line right on my numbers?

- Mark as New
- Bookmark
- Subscribe
- Mute
- Subscribe to RSS Feed
- Get Direct Link
- Report Inappropriate Content
How to configure the axis to make the grid line right on my numbers?
Hi folks,
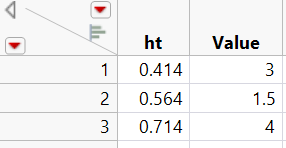
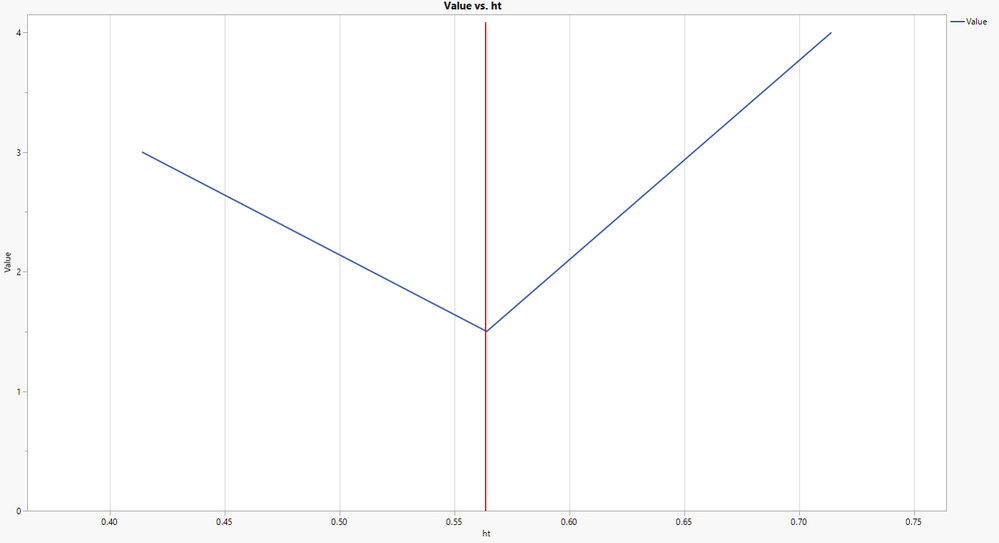
I have the following data table and plot "Value vs. ht". I would like to have 0.414, 0.564 and 0.714 as the grid lines from the x axis instead of the 0.5, 0.55 and 0.60 those natural numbers? The Excel is easy to do it, but I had a hard time to do it in JMP. Thank you for the help.


- Mark as New
- Bookmark
- Subscribe
- Mute
- Subscribe to RSS Feed
- Get Direct Link
- Report Inappropriate Content
Re: How to configure the axis to make the grid line right on my numbers?
Right click on the axis in question, and select Axis Settings. There you can set the axes to what you want
- Mark as New
- Bookmark
- Subscribe
- Mute
- Subscribe to RSS Feed
- Get Direct Link
- Report Inappropriate Content
Re: How to configure the axis to make the grid line right on my numbers?
Hi Jim,
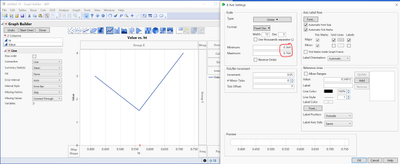
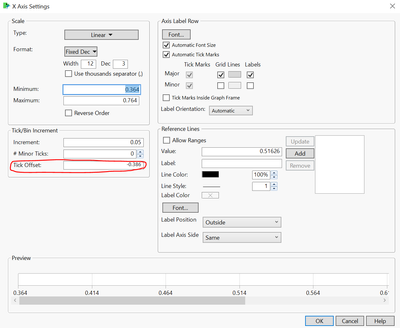
I know how to set the min and max as shown below. But setting the min as 0.364 and max at 0.764 does not make the grid lines from those decimal values at 0.414, 0.564 and 0.714. Please advise it. Thank you.
- Mark as New
- Bookmark
- Subscribe
- Mute
- Subscribe to RSS Feed
- Get Direct Link
- Report Inappropriate Content
Re: How to configure the axis to make the grid line right on my numbers?
Hi Jim,
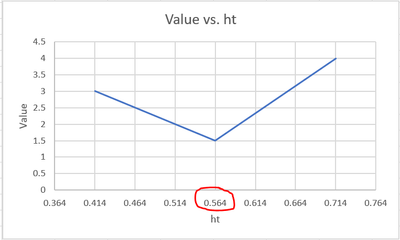
The following is what I plotted from Excel, the grid lines are right on the three x values instead of on the 0.4, 0.5, 0.6 (natural step). How can we configure JMP to have the similar gridlines. Thank you.
- Mark as New
- Bookmark
- Subscribe
- Mute
- Subscribe to RSS Feed
- Get Direct Link
- Report Inappropriate Content
Re: How to configure the axis to make the grid line right on my numbers?
Hi Jim,
I think the following is the key, I need to set the tick offset. Thanks.
Recommended Articles
- © 2026 JMP Statistical Discovery LLC. All Rights Reserved.
- Terms of Use
- Privacy Statement
- Contact Us