- Learn how to build custom Python data connectors and further customize JMP’s Data Connector Framework with the Python Data Connector Demo, available now in the JMP Marketplace!
- See how to move from signal modeling to system modeling at the first JMP Aerospace Analytics webinar. Register. June 18, 1 p.m. US Eastern Time.
- Subscribe to RSS Feed
- Mark Topic as New
- Mark Topic as Read
- Float this Topic for Current User
- Bookmark
- Subscribe
- Mute
- Printer Friendly Page
Discussions
Solve problems, and share tips and tricks with other JMP users.- JMP User Community
- :
- Discussions
- :
- Can I use the 'Block' tab in 'Fit Y by X' to analyze my randomized complete bloc...

- Mark as New
- Bookmark
- Subscribe
- Mute
- Subscribe to RSS Feed
- Get Direct Link
- Report Inappropriate Content
Can I use the 'Block' tab in 'Fit Y by X' to analyze my randomized complete block design?
Hello,
I am trying to analyze a Randomized Complete Block Design (RCBD) experiment in JMP, but I did not create the experimental design in JMP (and I don't think I have the patience to figure out how to do that!). I just import my excel files to work from.
It was a field experiment where I sampled from 3 different blocks in a field (these are the replicates), and within each block I had 9 randomly assigned treatment (so 9 treatment plots, replicated 3 times). The treatments were 9 different cover crop types, so cover crop is the X factor. I then measured a lot of Y response variables from these plots. I used blocks because the soil inherently varied across the field, and I want to eliminate the 'noise' of these field site difference.
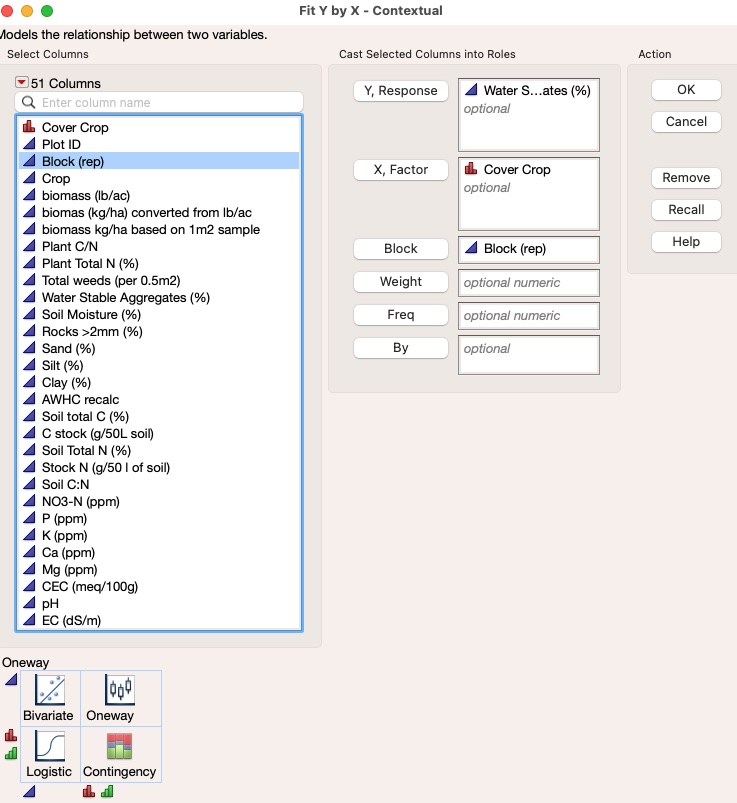
I was planning on running this as a simple 1-way ANOVA, but somehow taking into account the blocking. I tried using Analyze-> Fit Y by X, and then putting in my Y response variable, X factor, and my replicate (block) column in the 'Block' space (see screenshot 1). It gives me a result, and it shows what I believe are the correct number of Errors (see screenshot 2). However, I have read many articles about blocking in JMP, and no one suggests using this 'Block' tab... so maybe I am missing something? Is this too good to be true?
Do I instead need to use 'Fit Model', and assign the block to be a 'random effect'? If so, what do I select for the 'Personality', and what number do I put for 'Degree' in the effects area? (see screenshot 3). Do I want to click 'no intercept'?
That is a lot of questions! If anyone has some insight, I would greatly appreciate it :)
Thank you!

- Mark as New
- Bookmark
- Subscribe
- Mute
- Subscribe to RSS Feed
- Get Direct Link
- Report Inappropriate Content
Re: Can I use the 'Block' tab in 'Fit Y by X' to analyze my randomized complete block design?
ClareSoils, welcome to the community. I have some thoughts on your post, but realize there are multiple ways to analyze the data. Much depends on what questions you are trying to answer and how you want to analyze the data. There may be arguments as to which is "right".
1. It is fairly easy to create block designs in JMP, but much depends on whether you want to treat block as a random or fixed effect (a discussion for later). As a suggestion, it is most effective to attach your data table vs. screen shots.(you can anonymize the data)
2. If I interpret your post, you have one factor (crop type) tested at 9 levels in three blocks. What is the objective of your experiment? Are you looking for causal structure or to pick a best crop level or are you interested in how robust crop type is to block effect or what?
3. Typically I use Fit Model (Standard Least Squares, Effect Leverage), but I am usually doing multi-factor experiments. Fit Y by X should work for your purpose. Did you run both the fit model and the fit y by x? Did the results agree?
4. The purpose of blocking is not to "eliminate noise", but to assign it to the block. Your model will include a block effect with 2 degrees of freedom. Without blocking, that effect would be pooled in the MSe, decreasing the precision of the experiment.
- Mark as New
- Bookmark
- Subscribe
- Mute
- Subscribe to RSS Feed
- Get Direct Link
- Report Inappropriate Content
Re: Can I use the 'Block' tab in 'Fit Y by X' to analyze my randomized complete block design?
Hello statman, thank you for the warm welcome and for taking the time to post a response! I really appreciate it.
Responses to your questions:
1. All published papers I see for RCBD analysis assign Block (or replicate) as a 'random effect'. Thank you for the dataset suggestion - here it is! (warning: it has A LOT of response variables, and almost half of them have non-normal distribution... more on that later. The ones with non-normal distribution have a 'label').
2. Correct, I have one factor (cover crop type), and there are 9 cover crop treatments, tested in 3 blocks (and plots were randomly assigned to the blocks). The objective of the experiment is simply to evaluate the effect of the different cover crops on soil properties (which are all of the response variables). I took soil samples from each plot.
3. I just ran both the Fit Y by X (putting rep in 'Block' tab) and the Fit model (and put rep as a 'Random effect'), and I came out with the same p values! Ha, that is a relief :) There results were not coming out the same before, but I think it is because I had my rep (block) as a 'continuous variable', and when I changed it to 'nominal variable' it came out right. This leads me to believe that I can do Fit Y by X and use the 'Block' tab.
4. Yes, that is what I meant, but did not state correctly. Thank you for clarifying, and that is the reason I want to Block.
Other question:
As mentioned, many of my response variables have a non-normal distribution, so I was planning on using Kruskal-Wallis for analysis. I do not want to log-transform all of the data, and do other massaing until it fits a normal distribution. I have seen other papers in my field that do this - use ANOVA for normal distribution and K-W for non-normal. I have played around with this in JMP, and follow the same Fit Y by X procedure as above (putting Rep in the Block tab), and then just analyze the output for 'non-parametric test'. Do you know if this is ok to do? I also considered using the Friedman test, but my experiment is not repeated measures (I thought that was the common use of Friedman test).
Thank you very much for your time and expertise!
- Mark as New
- Bookmark
- Subscribe
- Mute
- Subscribe to RSS Feed
- Get Direct Link
- Report Inappropriate Content
Re: Can I use the 'Block' tab in 'Fit Y by X' to analyze my randomized complete block design?
May I suggest this paper:
Sanders, D., Leitnaker M., and McLean R. (2002) “Randomized Complete Block Designs in Industrial Studies” Quality Engineering, Vol. 14, Issue 1
I'm not saying this is what you should do in this case, but there are alternative methods.
Some follow-up thoughts:
1. Not to create a controversy and perhaps over-simplifying, I believe the normality of response variables from a DOE is not as important as many surmise (ANOVA is fairly robust). Think about it...you are purposely trying to change the response variables (y's) via the manipulation of predictor variables (x's). Why would you expect them to be normally distributed? What you want normally distributed is the residuals.
2. Since you are in the world of multivariate, I would suggest some multivariate analysis (at least run: Analyze>Multivariate Methods>Multivariate.
3. I am not an SME for your subject, but are you sure those are all outputs expected to be impacted by the experimental treatments? It appears some may be covariates (e.g., rocks, silt, sand, clay...). Perhaps make it a quantitative value, grain size.
4. How do you account for measurement errors for all of the y's (or is it known)? This would likely contribute to the MSe.
5. When I analyze lots of Y's, (he most I have had for a single experiment is 2781)I do a first screening of each Y for practical significance. Calculate the range for each column (Table>Summary>highlight Y's>select range from drop down Statistics button. If the Y does not change significantly enough for you to care about it (or it is not interesting from a scientific standpoint), leave it out of the analysis.
Recommended Articles
- © 2026 JMP Statistical Discovery LLC. All Rights Reserved.
- Terms of Use
- Privacy Statement
- Contact Us