Turn on suggestions
Auto-suggest helps you quickly narrow down your search results by suggesting possible matches as you type.
- JMP Statement Regarding Critical PHP Remote Code Execution Vulnerabilities (CVE-2026-109618, CVE-2026-109619)
- Don’t miss your chance to experience Discovery Summit Europe at our best available rate! Early bird registration through 31 Oct.
- Graph Builder Toolbar streamlines interactive graphing. Creates shortcuts on Report and GraphBuilder Helpers toolbars. Download and install the extension.
Options
- Subscribe to RSS Feed
- Mark Topic as New
- Mark Topic as Read
- Float this Topic for Current User
- Bookmark
- Subscribe
- Mute
- Printer Friendly Page
Discussions
Solve problems, and share tips and tricks with other JMP users.- User Community
- :
- Discussions
- :
- How to combine multiple plots in 1 tab using JSL

Level V
- Mark as New
- Bookmark
- Subscribe
- Mute
- Subscribe to RSS Feed
- Get Direct Link
- Report Inappropriate Content
How to combine multiple plots in 1 tab using JSL
Jan 22, 2024 08:13 PM
(2174 views)
Hi, I have two different plots and I would like to combine them in one tab on my journal.
dt=open("$SAMPLE_DATA/big class.jmp");

// Plot 1
biv = dt << Bivariate( invisible, Y( :height ), X( :weight ), By( :sex ) );

// Create the window, with the first tab
nw=New Window("Tabs", text box("here are the tabs"), tb = Tab Box((report(biv[1])[outlinebox(1)])<<get title ,report(biv[1])));

//Plot 2
biv2 = bivariate( x( :height ), y( :weight ), invisible );

tb << Append( "Plot 2", biv2 << Report); //what I currently do
My question is, how can I combine these two different plot in 1 tab? I am using JMP 15
1 ACCEPTED SOLUTION
Accepted Solutions


Super User
Solution
- Mark as New
- Bookmark
- Subscribe
- Mute
- Subscribe to RSS Feed
- Get Direct Link
- Report Inappropriate Content
Re: How to combine multiple plots in 1 tab using JSL
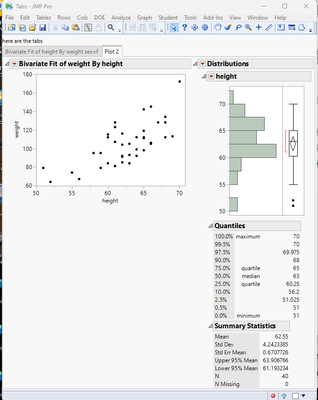
Try the below JSL, it is one way to do what you want
Names Default To Here( 1 );
dt = Open( "$SAMPLE_DATA/big class.jmp" );

// Plot 1
biv = dt << Bivariate( invisible, Y( :height ), X( :weight ), By( :sex ) );
dis = Distribution( Continuous Distribution( invisible, Column( :height ) ) );

// Create the window, with the first tab
nw = New Window( "Tabs",
	Text Box( "here are the tabs" ),
	tb = Tab Box( (Report( biv[1] )[Outline Box( 1 )]) << get title, Report( biv[1] ) )
);

//Plot 2
biv2 = bivariate( x( :height ), y( :weight ), invisible );

tb << Append( "Plot 2", hlb = H List Box( biv2 << Report ) ); // Add an H List Box to the tab

hlb << append( dis << report );  // Append additional items to the H List Box
Jim
1 REPLY 1
Super User
Solution
- Mark as New
- Bookmark
- Subscribe
- Mute
- Subscribe to RSS Feed
- Get Direct Link
- Report Inappropriate Content
Re: How to combine multiple plots in 1 tab using JSL
Try the below JSL, it is one way to do what you want
Names Default To Here( 1 );
dt = Open( "$SAMPLE_DATA/big class.jmp" );

// Plot 1
biv = dt << Bivariate( invisible, Y( :height ), X( :weight ), By( :sex ) );
dis = Distribution( Continuous Distribution( invisible, Column( :height ) ) );

// Create the window, with the first tab
nw = New Window( "Tabs",
	Text Box( "here are the tabs" ),
	tb = Tab Box( (Report( biv[1] )[Outline Box( 1 )]) << get title, Report( biv[1] ) )
);

//Plot 2
biv2 = bivariate( x( :height ), y( :weight ), invisible );

tb << Append( "Plot 2", hlb = H List Box( biv2 << Report ) ); // Add an H List Box to the tab

hlb << append( dis << report );  // Append additional items to the H List Box
Jim
Recommended Articles
- © 2026 JMP Statistical Discovery LLC. All Rights Reserved.
- Terms of Use
- Privacy Statement
- Contact Us