Turn on suggestions
Auto-suggest helps you quickly narrow down your search results by suggesting possible matches as you type.
- Don’t miss your chance to experience Discovery Summit Europe at our best available rate! Early bird registration through 31 Oct.
- Graph Builder Toolbar streamlines interactive graphing. Creates shortcuts on Report and GraphBuilder Helpers toolbars. Download and install the extension.
- JMP will suspend normal business operations for our Rest and Recharge Day on Friday, October 2, 2026.
Regular business hours will resume on Monday, October 5, 2026.
Options
- Subscribe to RSS Feed
- Mark Topic as New
- Mark Topic as Read
- Float this Topic for Current User
- Bookmark
- Subscribe
- Mute
- Printer Friendly Page
Discussions
Solve problems, and share tips and tricks with other JMP users.- User Community
- :
- Discussions
- :
- How to change the box-colour of SPC charts (Levey-Jennings) for all subgroup


Super User
- Mark as New
- Bookmark
- Subscribe
- Mute
- Subscribe to RSS Feed
- Get Direct Link
- Report Inappropriate Content
How to change the box-colour of SPC charts (Levey-Jennings) for all subgroup
Created:
Feb 13, 2023 03:37 AM
| Last Modified: Jun 8, 2023 9:36 AM
(2215 views)
Hello experts,
I've constructed an SPC chart which I like very much which I'm going to automate using scripting.
However, as you can see, the default box-plot colour is grey (i want to change to red or blue) for all boxes.
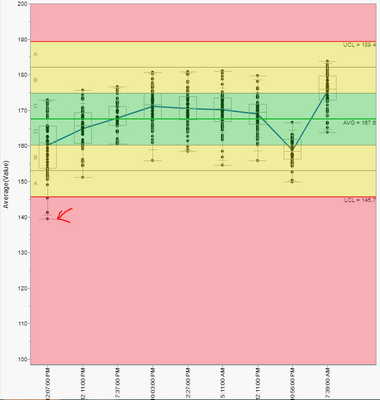
I can't find the settings in preference (JMP 16) to change the box colour from gray to blue.
I did notice that, I can use "Customize Graph" to change the line colour of each box plot but is there fastest way change all of the box-colour?
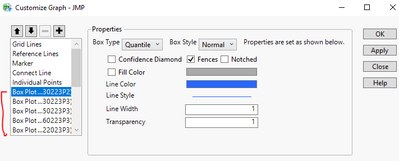
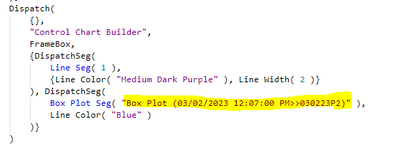
Thank you in advance!
1 ACCEPTED SOLUTION
Accepted Solutions

Super User
Solution
- Mark as New
- Bookmark
- Subscribe
- Mute
- Subscribe to RSS Feed
- Get Direct Link
- Report Inappropriate Content
Re: How to change the box-colour of SPC charts (Levey-Jennings) for all subgroup
XPath is one option
Names Default To Here(1);
dt = Open("$SAMPLE_DATA/Quality Control/Coating.jmp");
obj = dt << Control Chart Builder(
	Variables(Subgroup(:Sample), Y(:Weight)),
	Chart(
		Position(1),
		Points(Individual Points(1), Box Plots(1)),
		Limits(Sigma("Levey Jennings"), Zones(1), Shade Zones(1))
	),
	Show Control Panel(0)
);

wait(1);
boxsegs = report(obj) << XPath("//BoxPlotSeg");
boxsegs << Line Color("Blue");
-Jarmo
1 REPLY 1
Super User
Solution
- Mark as New
- Bookmark
- Subscribe
- Mute
- Subscribe to RSS Feed
- Get Direct Link
- Report Inappropriate Content
Re: How to change the box-colour of SPC charts (Levey-Jennings) for all subgroup
XPath is one option
Names Default To Here(1);
dt = Open("$SAMPLE_DATA/Quality Control/Coating.jmp");
obj = dt << Control Chart Builder(
	Variables(Subgroup(:Sample), Y(:Weight)),
	Chart(
		Position(1),
		Points(Individual Points(1), Box Plots(1)),
		Limits(Sigma("Levey Jennings"), Zones(1), Shade Zones(1))
	),
	Show Control Panel(0)
);

wait(1);
boxsegs = report(obj) << XPath("//BoxPlotSeg");
boxsegs << Line Color("Blue");
-Jarmo
Recommended Articles
- © 2026 JMP Statistical Discovery LLC. All Rights Reserved.
- Terms of Use
- Privacy Statement
- Contact Us