Turn on suggestions
Auto-suggest helps you quickly narrow down your search results by suggesting possible matches as you type.
- New to JMP? Let the Data Analysis Director guide you through selecting an analysis task, an analysis goal, and a data type. Available now in the JMP Marketplace!
- See how to install JMP Marketplace extensions to customize and enhance JMP.
Options
- Subscribe to RSS Feed
- Mark Topic as New
- Mark Topic as Read
- Float this Topic for Current User
- Bookmark
- Subscribe
- Mute
- Printer Friendly Page
Discussions
Solve problems, and share tips and tricks with other JMP users.- JMP User Community
- :
- Discussions
- :
- Re: How to add the confidence intervals to a logistic regression plot?

Level I
- Mark as New
- Bookmark
- Subscribe
- Mute
- Subscribe to RSS Feed
- Get Direct Link
- Report Inappropriate Content
How to add the confidence intervals to a logistic regression plot?
Created:
Sep 15, 2022 12:08 PM
| Last Modified: Jun 11, 2023 4:27 AM
(3807 views)
Hi,
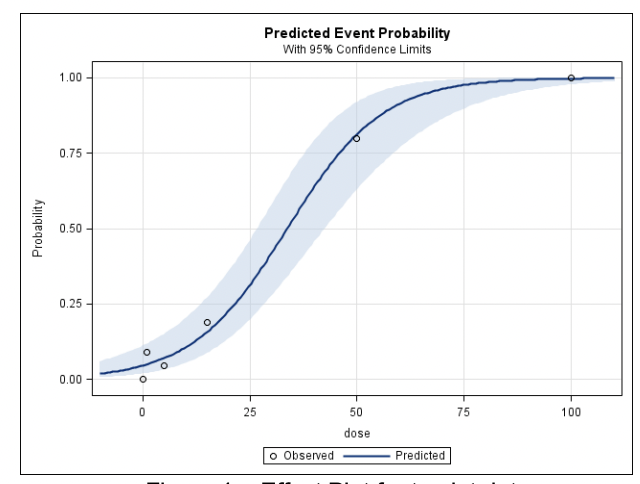
I am trying to use the Fit Model in JMP to do logistic regression and draw a logistic plot (probability of response vs predictor). In that plot, it only shows a predicted line. Does anyone know how to add the 95% confidence interval to that plot? Here is the plot I want.
- Tags:
- windows
1 ACCEPTED SOLUTION
Accepted Solutions

Level VII
Solution
- Mark as New
- Bookmark
- Subscribe
- Mute
- Subscribe to RSS Feed
- Get Direct Link
- Report Inappropriate Content
Re: How to add the confidence intervals to a logistic regression plot?


2 REPLIES 2
Level VII
Solution
- Mark as New
- Bookmark
- Subscribe
- Mute
- Subscribe to RSS Feed
- Get Direct Link
- Report Inappropriate Content
Re: How to add the confidence intervals to a logistic regression plot?
You may want to use GLM:
Then turn on Profiler:
Level I
- Mark as New
- Bookmark
- Subscribe
- Mute
- Subscribe to RSS Feed
- Get Direct Link
- Report Inappropriate Content
Re: How to add the confidence intervals to a logistic regression plot?
It woks. Thanks for your help!
Recommended Articles
- © 2026 JMP Statistical Discovery LLC. All Rights Reserved.
- Terms of Use
- Privacy Statement
- Contact Us