- Don’t miss your chance to experience Discovery Summit Europe at our best available rate! Early bird registration through 31 Oct.
- Graph Builder Toolbar streamlines interactive graphing. Creates shortcuts on Report and GraphBuilder Helpers toolbars. Download and install the extension.
- Subscribe to RSS Feed
- Mark Topic as New
- Mark Topic as Read
- Float this Topic for Current User
- Bookmark
- Subscribe
- Mute
- Printer Friendly Page
Discussions
Solve problems, and share tips and tricks with other JMP users.- User Community
- :
- Discussions
- :
- How to? Bland Altman Plot in Percentage (Matched Pairs)

- Mark as New
- Bookmark
- Subscribe
- Mute
- Subscribe to RSS Feed
- Get Direct Link
- Report Inappropriate Content
How to? Bland Altman Plot in Percentage (Matched Pairs)
Hello!
How do i make the Matched Pairs graph to give results in percentage?
I also can see it doesn't have options for ratio, or log.
I am just comparing one pair of data, and the differences assume a non-normal distribution and magnitude as an influence on the differences, and they are also proportional to variability, differences assume positive and negative values.
So i assume the proper way to make an analysis of agreement is to plot the percentages.
How can i do that?


- Mark as New
- Bookmark
- Subscribe
- Mute
- Subscribe to RSS Feed
- Get Direct Link
- Report Inappropriate Content
Re: How to? Bland Altman Plot in Percentage (Matched Pairs)
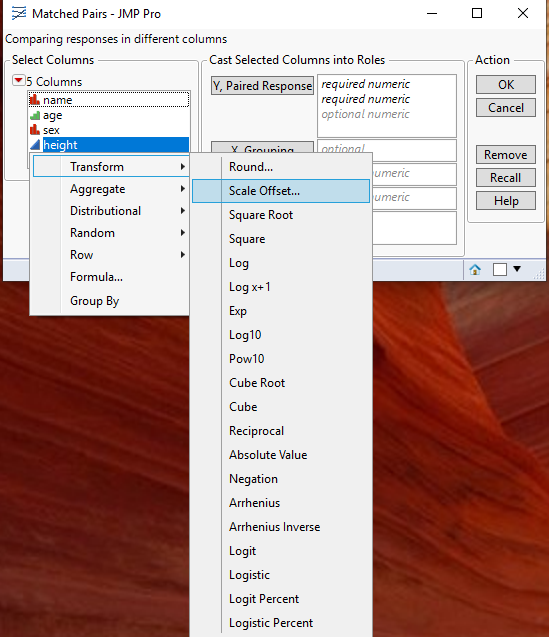
You can change the output scale to several different options by right clicking on the axis you want to change, and then selecting "Axis Settings". It can handle a log axis. However if you are looking for the differences to be in percentages or ratios, you may need to transform your data. This can be done when selecting the data. When you open the Matched Pairs Platform, you can transform the data into the values you want by simply right clicking on the column you want to transform and then to select the appropriate transform. Not all transforms are selectable. You may need to use your own formula and create the transformed data. For your request for a log, it is selectable, however for a ratio or a percentage, you will need to use the Formula option, and specify the formula to be used in the transformation
- Mark as New
- Bookmark
- Subscribe
- Mute
- Subscribe to RSS Feed
- Get Direct Link
- Report Inappropriate Content
Re: How to? Bland Altman Plot in Percentage (Matched Pairs)
Good to know these options, seems that answers my question.
but for example when I transform the a and b columns for the y responses how do I set the plotted x-axis to the mean of a and b column without transformation?
I believe for percentages and ratio plot the x-axis mean remains without transformation, only on log graphs the mean are also logarithmical.
Recommended Articles
- © 2026 JMP Statistical Discovery LLC. All Rights Reserved.
- Terms of Use
- Privacy Statement
- Contact Us