- Don’t miss your chance to experience Discovery Summit Europe at our best available rate! Early bird registration through 31 Oct.
- Graph Builder Toolbar streamlines interactive graphing. Creates shortcuts on Report and GraphBuilder Helpers toolbars. Download and install the extension.
- Subscribe to RSS Feed
- Mark Topic as New
- Mark Topic as Read
- Float this Topic for Current User
- Bookmark
- Subscribe
- Mute
- Printer Friendly Page
Discussions
Solve problems, and share tips and tricks with other JMP users.- User Community
- :
- Discussions
- :
- Re: Graph Builder Box Plot

- Mark as New
- Bookmark
- Subscribe
- Mute
- Subscribe to RSS Feed
- Get Direct Link
- Report Inappropriate Content
How to Add Multiple Elements to a Graph Builder Box Plot
When using graph builder and selecting a box plot, how do I make all the date points show and not just the outliers?
Accepted Solutions


 Community Manager
- Mark as New
- Bookmark
- Subscribe
- Mute
- Subscribe to RSS Feed
- Get Direct Link
- Report Inappropriate Content
Re: Graph Builder Box Plot
Hi geparker,
You can do this a few different ways. After generating the box plot in graph builder you can right click the graph, select add, then select points. Alternatively, you can add the points on top of the box plot by dragging the icon with points (in the pallete above the graph) on top of the graph. Dragging a visual (rather than clicking it) adds the visualization to the current plot (rather than replacing it).
I hope this helps,
- Mark as New
- Bookmark
- Subscribe
- Mute
- Subscribe to RSS Feed
- Get Direct Link
- Report Inappropriate Content
Re: Graph Builder Box Plot
*data
Community Manager
- Mark as New
- Bookmark
- Subscribe
- Mute
- Subscribe to RSS Feed
- Get Direct Link
- Report Inappropriate Content
Re: Graph Builder Box Plot
Hi geparker,
You can do this a few different ways. After generating the box plot in graph builder you can right click the graph, select add, then select points. Alternatively, you can add the points on top of the box plot by dragging the icon with points (in the pallete above the graph) on top of the graph. Dragging a visual (rather than clicking it) adds the visualization to the current plot (rather than replacing it).
I hope this helps,

- Mark as New
- Bookmark
- Subscribe
- Mute
- Subscribe to RSS Feed
- Get Direct Link
- Report Inappropriate Content
Re: Graph Builder Box Plot
Julian,
What if you have multiple sub-categories per main category like below? How do you get the points map to align with the box plot rather than just a jitter over the entire category?
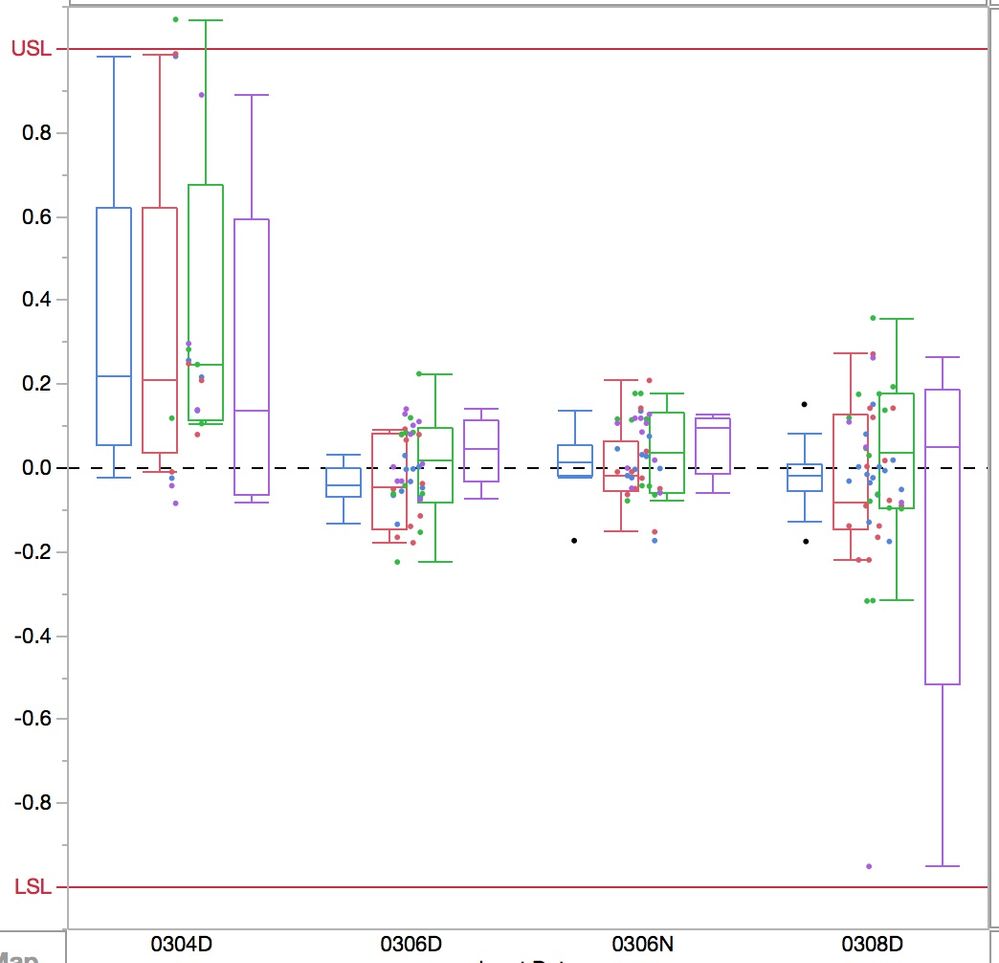
I've been trying to figure this one out and starting to think JMP can't do this yet...

- Mark as New
- Bookmark
- Subscribe
- Mute
- Subscribe to RSS Feed
- Get Direct Link
- Report Inappropriate Content
Re: Graph Builder Box Plot
Simply drag the column with the sub-categories to the top of the X axis to add it and nest it under the main category.

- Mark as New
- Bookmark
- Subscribe
- Mute
- Subscribe to RSS Feed
- Get Direct Link
- Report Inappropriate Content
Re: Graph Builder Box Plot
geparker,
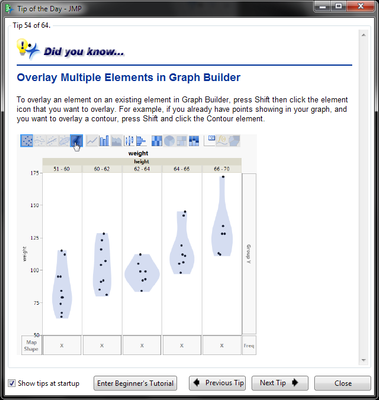
Guess what's my JMP 12's Tip of the day (54 of 64)?
To overlay an element on an existing element in Graph Builder, press Shift then click the element icon that you want to overlay (image below).
julian,
Thanks for your youtube channels! I'm learning a lot from them.
- Randy, JMP newbie
Recommended Articles
- © 2026 JMP Statistical Discovery LLC. All Rights Reserved.
- Terms of Use
- Privacy Statement
- Contact Us