- Subscribe to RSS Feed
- Mark Topic as New
- Mark Topic as Read
- Float this Topic for Current User
- Bookmark
- Subscribe
- Mute
- Printer Friendly Page
Discussions
Solve problems, and share tips and tricks with other JMP users.- JMP User Community
- :
- Discussions
- :
- Re: How do I plot mathematical functions with JMP?
- Mark as New
- Bookmark
- Subscribe
- Mute
- Subscribe to RSS Feed
- Get Direct Link
- Report Inappropriate Content
How do I plot mathematical functions with JMP?
I realize that JMP isn't a mathematical function plotter, but suppose I have a function: y=((v1+v2)*sin(v3+arcsine(v1/(v1+v2)))/sin(pi()-v3-arcsine(v1/(v1+v2))-v4/v1)-v1)
... and I'd like to plot it using Graph Builder. Is there a convenient way to do this type of thing with JMP? (preferably without resorting to JSL)
Seems like it would involve building a full-factorial matrix of inputs v1 thru v4, but it's not clear to me how to do that, even with the DOE FFD platform, especially if I'd like some of those variables to have hundreds of values, e.g., v1 to be 0 thru 5000 every 10.
- Mark as New
- Bookmark
- Subscribe
- Mute
- Subscribe to RSS Feed
- Get Direct Link
- Report Inappropriate Content
Re: How do I plot mathematical functions with JMP?
- Mark as New
- Bookmark
- Subscribe
- Mute
- Subscribe to RSS Feed
- Get Direct Link
- Report Inappropriate Content
Re: How do I plot mathematical functions with JMP?
I do not think that Graph Builder will work, even though it can plot the graph of a function of one independent variable. The only roles available for a case like this is X and Y. You have four independent variables, so the plot is 5 dimensions.
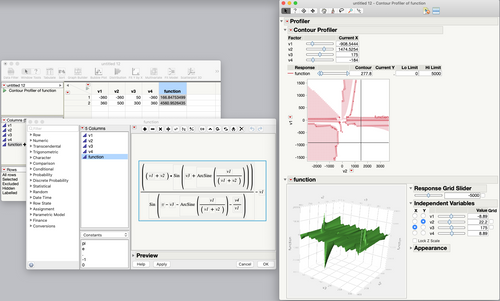
Would the Profiler suffice? If so, make a new data table. Create a data column for V1-V4 and Y. You do not need a grid. Add two rows to the data table and enter the minimum and maximum value for each independent variable. Enter the formula for the function to the Y column.
Then select Graph > Profiler and enter Y for the formula. You will likely have to manually adjust the Y axis in the profiler. The algorithm won't detect the cyclic extremes in your function well on its own.
I attached the data table for my set up and a table script to launch the profiler for you to play with.
- Mark as New
- Bookmark
- Subscribe
- Mute
- Subscribe to RSS Feed
- Get Direct Link
- Report Inappropriate Content
Re: How do I plot mathematical functions with JMP?
- Mark as New
- Bookmark
- Subscribe
- Mute
- Subscribe to RSS Feed
- Get Direct Link
- Report Inappropriate Content
Re: How do I plot mathematical functions with JMP?
I did not mean to imply that Graph Builder is limited to just two variables. But visualizing this function would require some clear thinking about what you wanted to show and how you wanted to show it. I agree that GB can bring in more than two variables through different roles.
Also using the grouping and overlay roles limits the display to the levels in the column, so you would also have to build the data table more carefully to get the groups you want.
- Mark as New
- Bookmark
- Subscribe
- Mute
- Subscribe to RSS Feed
- Get Direct Link
- Report Inappropriate Content
Re: How do I plot mathematical functions with JMP?
- Mark as New
- Bookmark
- Subscribe
- Mute
- Subscribe to RSS Feed
- Get Direct Link
- Report Inappropriate Content
Re: How do I plot mathematical functions with JMP?
Use the DOE > Classical > Full Factorial design platform. You can ignore or delete the meta-data that is created, too. You won't need it since you are not fitting empirical data.
- Mark as New
- Bookmark
- Subscribe
- Mute
- Subscribe to RSS Feed
- Get Direct Link
- Report Inappropriate Content
Re: How do I plot mathematical functions with JMP?
- Mark as New
- Bookmark
- Subscribe
- Mute
- Subscribe to RSS Feed
- Get Direct Link
- Report Inappropriate Content
Re: How do I plot mathematical functions with JMP?
@BHarris wrote:
I understand -- I think I was mostly interested in knowing *how* to build the data table if I knew what levels I wanted for each of the inputs. Basically, is there an easy way to build a full-factorial-matrix data table given a min, increment, and max value for each variable?
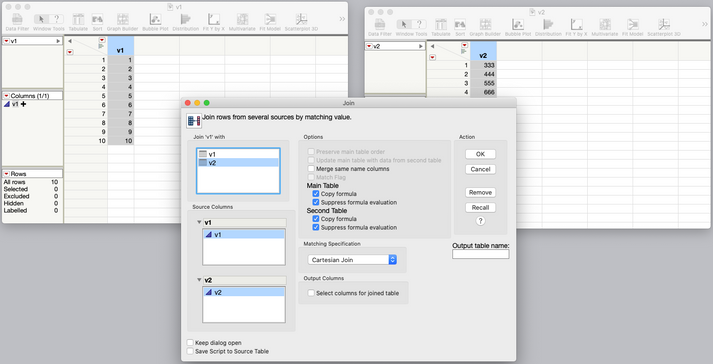
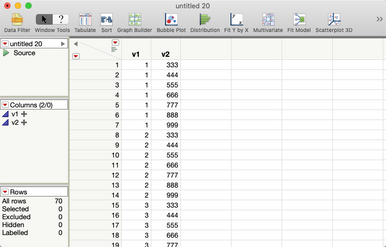
Take a look at the Sequence() function (it's the Row functions in the Formula Editor), and also Tables->Join, where you'll find a Cartesian join option.


- Mark as New
- Bookmark
- Subscribe
- Mute
- Subscribe to RSS Feed
- Get Direct Link
- Report Inappropriate Content
Re: How do I plot mathematical functions with JMP?
- Mark as New
- Bookmark
- Subscribe
- Mute
- Subscribe to RSS Feed
- Get Direct Link
- Report Inappropriate Content
Re: How do I plot mathematical functions with JMP?
- « Previous
-
- 1
- 2
- Next »
Recommended Articles
- © 2026 JMP Statistical Discovery LLC. All Rights Reserved.
- Terms of Use
- Privacy Statement
- Contact Us


