cancel
Showing results for 
Show  only  | Search instead for 
Did you mean: 
  • DownloadSemiconductor Toolkit: Tools to create wafer maps, add wafer geometry to graphics, explore die defects & compare wafers.
  • Discovery Summit 2026: Early User Edition - September 23-24.Register. It's free.
  • Use JMP Clinical with CDISC-compliant data. Review studies, ID safety and efficacy signals & communicate findings with interactive graphics. Register to see how. Aug. 27, 2 pm US ET.

Discussions

Solve problems, and share tips and tricks with other JMP users.
Choose Language Hide Translation Bar
Ellabluebird
Level I

How do I interpret wilcoxon results table?

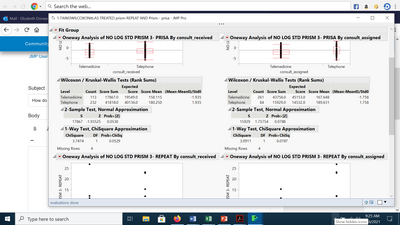
Ellabluebird_0-1610119520395.png


I understand  the prob/ Chi Sq is my P value here. most of my tests were non significant. But hwat does the " Score mean" mean?


Its a non parametric test so it should be median, correct?

I'm trying to set up a results table and don't know how to show numerically the data that is significant and approaches significance.  This is what I had hoped to present but My mentors are confused because my data is non parametric and wilxocon by definition is a non parametric test.I guess I can just show box plots of the data....
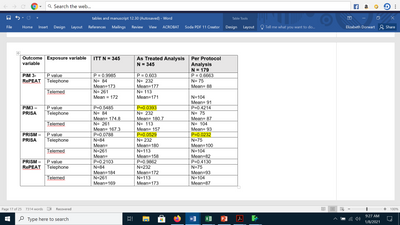

 

Ellabluebird_1-1610119677671.png


1 REPLY 1

Re: How do I interpret wilcoxon results table?

Please see the JMP documentation for this test.


Yes, it is a non-parametric test. That is, it is not based on a distribution model parameter. It is based on the ranks of the data. The scores are comparisons of the ranks to the median. The mean score summarizes each group. The difference in the mean scores is zero under the null hypothesis. That is, you expect about the same ranks in both groups when there is no difference between the groups.

Recommended Articles
