- Don’t miss your chance to experience Discovery Summit Europe at our best available rate! Early bird registration through 31 Oct.
- Graph Builder Toolbar streamlines interactive graphing. Creates shortcuts on Report and GraphBuilder Helpers toolbars. Download and install the extension.
- JMP will suspend normal business operations for our Rest and Recharge Day on Friday, October 2, 2026.
Regular business hours will resume on Monday, October 5, 2026.
- Subscribe to RSS Feed
- Mark Topic as New
- Mark Topic as Read
- Float this Topic for Current User
- Bookmark
- Subscribe
- Mute
- Printer Friendly Page
Discussions
Solve problems, and share tips and tricks with other JMP users.- User Community
- :
- Discussions
- :
- Re: How can we determine the local maxima in a multi-peaked distribution?

- Mark as New
- Bookmark
- Subscribe
- Mute
- Subscribe to RSS Feed
- Get Direct Link
- Report Inappropriate Content
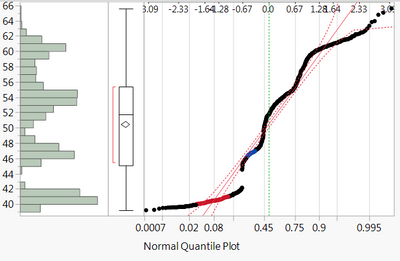
How can we determine the local maxima in a multi-peaked distribution?
We'd like to be able to determine the maximum values of multi-peaked distribution, such as the one below, with some algorithm or utility.
Any ideas how that can be done?
Accepted Solutions

- Mark as New
- Bookmark
- Subscribe
- Mute
- Subscribe to RSS Feed
- Get Direct Link
- Report Inappropriate Content
Re: How can we determine the local maxima in a multi-peaked distribution?
If you get the number of peaks by inspection, you could try something like this:
NamesDefaultToHere(1);
// Make some random data (with known parameters)
d1 = J(40, 1, RandomNormal(0, 1));
d2 = J(60, 1, RandomNormal(4, 2));
d3 = J(30, 1, RandomNormal(-6, 1));
// Make a table
dt = AsTable(VConcat(d1, d2, d3));
dt << setName("A Mixture of Samples from Three Gaussians");
Column(dt, "Col1") << setName("Y");
// Do a 'Normal Mixtures' analysis
dt << Distribution(
Continuous Distribution(
Column( :Y ),
Vertical( 0 ),
Fit Distribution( Normal Mixtures( Clusters( 3 ) ) )
),
Histograms Only,
SendToReport(
Dispatch(
{"Y"},
"Distrib Histogram",
FrameBox,
{Frame Size( 600, 267 ), DispatchSeg( Hist Seg( 1 ), Bin Span( 2, 0 ) )}
)
)
);
- Mark as New
- Bookmark
- Subscribe
- Mute
- Subscribe to RSS Feed
- Get Direct Link
- Report Inappropriate Content
Re: How can we determine the local maxima in a multi-peaked distribution?
If you get the number of peaks by inspection, you could try something like this:
NamesDefaultToHere(1);
// Make some random data (with known parameters)
d1 = J(40, 1, RandomNormal(0, 1));
d2 = J(60, 1, RandomNormal(4, 2));
d3 = J(30, 1, RandomNormal(-6, 1));
// Make a table
dt = AsTable(VConcat(d1, d2, d3));
dt << setName("A Mixture of Samples from Three Gaussians");
Column(dt, "Col1") << setName("Y");
// Do a 'Normal Mixtures' analysis
dt << Distribution(
Continuous Distribution(
Column( :Y ),
Vertical( 0 ),
Fit Distribution( Normal Mixtures( Clusters( 3 ) ) )
),
Histograms Only,
SendToReport(
Dispatch(
{"Y"},
"Distrib Histogram",
FrameBox,
{Frame Size( 600, 267 ), DispatchSeg( Hist Seg( 1 ), Bin Span( 2, 0 ) )}
)
)
);
Recommended Articles
- © 2026 JMP Statistical Discovery LLC. All Rights Reserved.
- Terms of Use
- Privacy Statement
- Contact Us