- Don’t miss your chance to experience Discovery Summit Europe at our best available rate! Early bird registration through 31 Oct.
- Graph Builder Toolbar streamlines interactive graphing. Creates shortcuts on Report and GraphBuilder Helpers toolbars. Download and install the extension.
- Subscribe to RSS Feed
- Mark Topic as New
- Mark Topic as Read
- Float this Topic for Current User
- Bookmark
- Subscribe
- Mute
- Printer Friendly Page
Discussions
Solve problems, and share tips and tricks with other JMP users.- User Community
- :
- Discussions
- :
- How can I generate a leverage plot in graph builder based off the leverage plot ...

- Mark as New
- Bookmark
- Subscribe
- Mute
- Subscribe to RSS Feed
- Get Direct Link
- Report Inappropriate Content
How can I generate a leverage plot in graph builder based off the leverage plot generated when running a Fit Model in JMP 16
I want to create a leverage plot in Graph Builder based on the leverage plot from a model I created using the Fit Model function and with a plot of the residuals directly beneath it. Something like this:
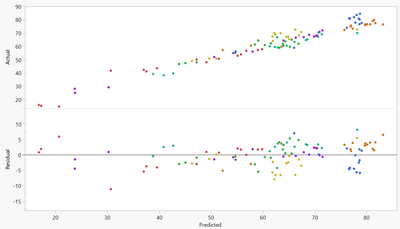
The top plot should be the leverage plot with the line for the alternative hypothesis and shading based on the 95% confidence interval and the bottom plot should be the residual plot. Another post had a solution about creating a shaded confidence interval in graph builder (Link), but I don't have experience with scripting so I did know how to adapt the script they used for this purpose or how to find the formula for line for the alternative hypothesis (wasn't sure if it was just a y=x line)
Thanks!
Accepted Solutions


- Mark as New
- Bookmark
- Subscribe
- Mute
- Subscribe to RSS Feed
- Get Direct Link
- Report Inappropriate Content
Re: How can I generate a leverage plot in graph builder based off the leverage plot generated when running a Fit Model in JMP 16
Unless you're willing to learn a fair bit of JSL, this isn't going to be that easy.
The details of how to construct the leverage plots are here:
A super easy way to make this figure is to journal both the leverage plot and the residual plots from the Fit Model platfrom
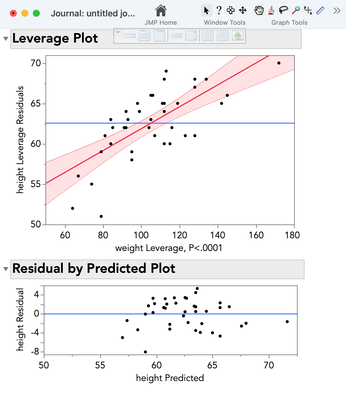
File>new journal
run the analysis in fir model
turn on the select tool (type "s" on keyboard)
click on the first graph, then Ctrl+j to journal it
click on the second graph and do the same thing.
- Mark as New
- Bookmark
- Subscribe
- Mute
- Subscribe to RSS Feed
- Get Direct Link
- Report Inappropriate Content
Re: How can I generate a leverage plot in graph builder based off the leverage plot generated when running a Fit Model in JMP 16
Unless you're willing to learn a fair bit of JSL, this isn't going to be that easy.
The details of how to construct the leverage plots are here:
A super easy way to make this figure is to journal both the leverage plot and the residual plots from the Fit Model platfrom
File>new journal
run the analysis in fir model
turn on the select tool (type "s" on keyboard)
click on the first graph, then Ctrl+j to journal it
click on the second graph and do the same thing.
Recommended Articles
- © 2026 JMP Statistical Discovery LLC. All Rights Reserved.
- Terms of Use
- Privacy Statement
- Contact Us