- Don’t miss your chance to experience Discovery Summit Europe at our best available rate! Early bird registration through 31 Oct.
- Graph Builder Toolbar streamlines interactive graphing. Creates shortcuts on Report and GraphBuilder Helpers toolbars. Download and install the extension.
- Subscribe to RSS Feed
- Mark Topic as New
- Mark Topic as Read
- Float this Topic for Current User
- Bookmark
- Subscribe
- Mute
- Printer Friendly Page
Discussions
Solve problems, and share tips and tricks with other JMP users.- User Community
- :
- Discussions
- :
- Re: Histogram Borders - control over bin size?

- Mark as New
- Bookmark
- Subscribe
- Mute
- Subscribe to RSS Feed
- Get Direct Link
- Report Inappropriate Content
Histogram Borders - control over bin size?
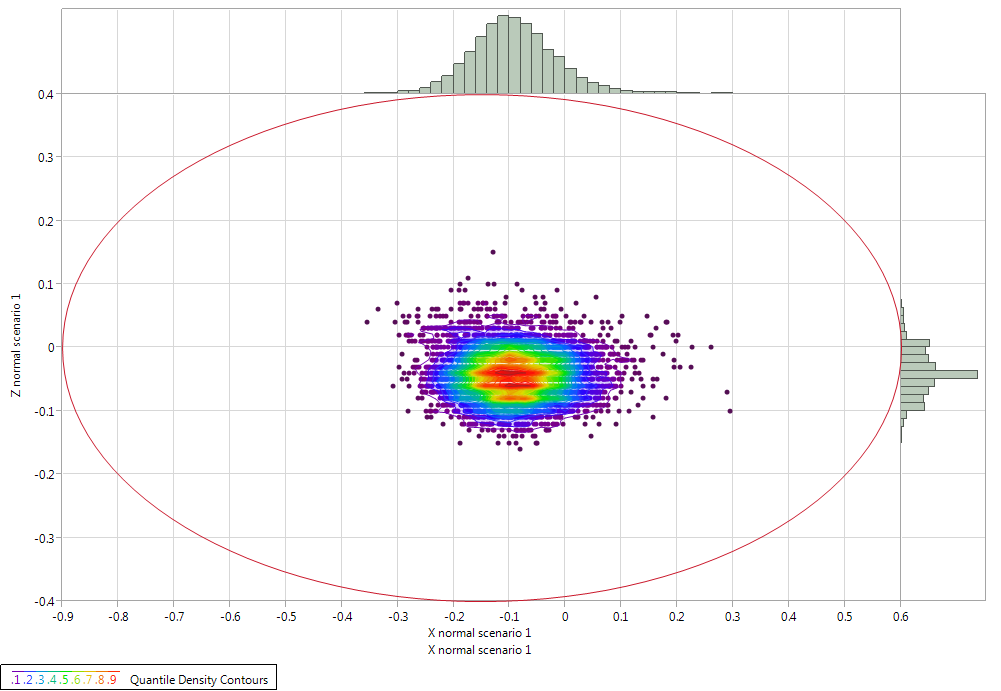
I have a graph of a bivariate fit of 2 variables to which I have applied Histogram Borders (image attached).
The help pages give no information with respect to controlling the bin sizes of these. Of the various options applicable to ordinary single variable histogram graphs, only the Grabber tool seems to be available for Histogram Borders. Unfortunately, this tool is imprecise and I can’t get it to quite do the business. I’d like to have equal width bins for both axes (as they share the same unit) and sensible upper and lower thresholds for each bin (i.e. starting/finishing at round numbers). Any ideas how to control this?
Accepted Solutions


 Community Manager
- Mark as New
- Bookmark
- Subscribe
- Mute
- Subscribe to RSS Feed
- Get Direct Link
- Report Inappropriate Content
Re: Histogram Borders - control over bin size?
Hi Outliar,
The histogram borders in Fit Y by X inherit their bin sizes from the axes themselves. To change the bin sizes you can double click each axis and change the "increment" to whatever bin width you need. If you wish to have fewer labels on the axis but want smaller bins, you can use the "# minor ticks" to reduce the bin size by a factor of whatever you specify. You can also change the min/max for each axis, which can control where your bins' start and stop.
I hope this helps!
Julian
Community Manager
- Mark as New
- Bookmark
- Subscribe
- Mute
- Subscribe to RSS Feed
- Get Direct Link
- Report Inappropriate Content
Re: Histogram Borders - control over bin size?
Hi Outliar,
The histogram borders in Fit Y by X inherit their bin sizes from the axes themselves. To change the bin sizes you can double click each axis and change the "increment" to whatever bin width you need. If you wish to have fewer labels on the axis but want smaller bins, you can use the "# minor ticks" to reduce the bin size by a factor of whatever you specify. You can also change the min/max for each axis, which can control where your bins' start and stop.
I hope this helps!
Julian
- Mark as New
- Bookmark
- Subscribe
- Mute
- Subscribe to RSS Feed
- Get Direct Link
- Report Inappropriate Content
Re: Histogram Borders - control over bin size?
Hi Julian,
Thanks for that. Works a treat.
Outliar
Recommended Articles
- © 2026 JMP Statistical Discovery LLC. All Rights Reserved.
- Terms of Use
- Privacy Statement
- Contact Us