In my search for aliens in BigClass, today I want to generate a heatmap plot to show the aliens at a glance.
The idea: color the non-alien students green and the aliens red.
But with several non-aliens in the same age group, the alien red is just slightly visible:
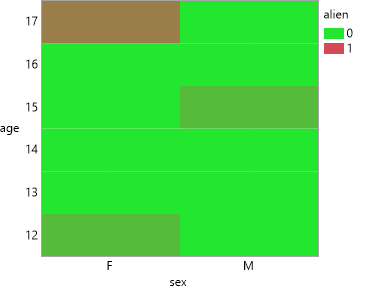
Next idea:
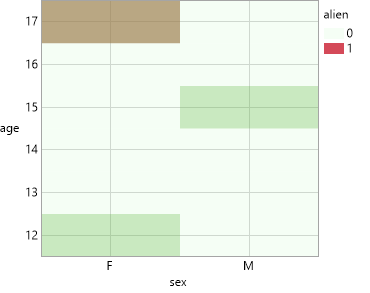
Let's increase the transparency for non-aliens such that age groups with aliens inside get nicely visible.
I exected such cells to get red (with some greenish touch) - but they are quite green, not red.
Seems that transparency is not treated separately for different colors, but mixed as well and then applied to the mixed color.
So, 5% green + 100% red gives
last attempt:
change the data type and use Max summary Statistics:
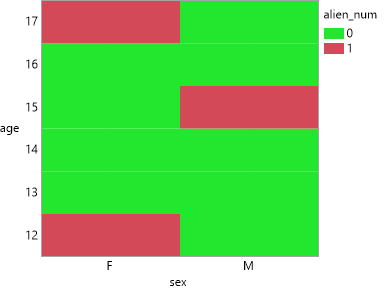
Sometimes it's easier to switch from character to numbers, if you want to aggregate - like here.
But aggregation of character values has also some potential:
Summary and Tabulate: add aggregation option for Character columns
Names Default To Here( 1 );
dt = Open( "$SAMPLE_DATA/Big Class.jmp" );
dt << New Column( "alien", Character,nominal, set each value( "-" ) );
dt << add rows( {name = "XX", alien = "alien", sex = "M", age = 15} );
dt << add rows( {name = "YZ", alien = "alien", sex = "F", age = 12} );
dt << add rows( {name = "KR", alien = "alien", sex = "F", age = 17} );


// first attempt
dt << Graph Builder(
	Variables( X( :sex ), Y( :age ), Color( :alien ) ),
	Elements( Heatmap( X, Y, Legend( 10 ) ) ),
	SendToReport(
		Dispatch({},"400",ScaleBox,
			{Legend Model( 10, Properties( 0, {Fill Color( 36 )}, Item ID( "-", 1 ) ) )}
		)
	)
);

// second attempt: increase transparency for non-aliens
dt << Graph Builder(
	Variables( X( :sex ), Y( :age ), Color( :alien ) ),
	Elements( Heatmap( X, Y, Legend( 10 ) ) ),
	SendToReport(
		Dispatch(
			{},
			"400",
			ScaleBox,
			{Legend Model( 10, Properties( 0, {Fill Color( 36 ), Transparency( 0.05 )}, Item ID( "-", 1 ) ) )}
		)
	)
);

// 3rd attempt: aggregate
Graph Builder(
	Variables(
		X( :sex ),
		Y( :age ),
		Color( :alien_num, Summary Statistic( "Max" ) )
	),
	Elements( Heatmap( X, Y, Legend( 10 ) ) ),
	SendToReport(
		Dispatch(
			{},
			"400",
			ScaleBox,
			{Legend Model(
				10,
				Properties( 0, {Fill Color( 36 )}, Item ID( "0", 1 ) )
			)}
		)
	)
)
