Turn on suggestions
Auto-suggest helps you quickly narrow down your search results by suggesting possible matches as you type.
- Don’t miss your chance to experience Discovery Summit Europe at our best available rate! Early bird registration through 31 Oct.
- Graph Builder Toolbar streamlines interactive graphing. Creates shortcuts on Report and GraphBuilder Helpers toolbars. Download and install the extension.
Options
- Subscribe to RSS Feed
- Mark Topic as New
- Mark Topic as Read
- Float this Topic for Current User
- Bookmark
- Subscribe
- Mute
- Printer Friendly Page
Discussions
Solve problems, and share tips and tricks with other JMP users.- User Community
- :
- Discussions
- :
- Re: GraphBuilder Challenge

Level XIII
- Mark as New
- Bookmark
- Subscribe
- Mute
- Subscribe to RSS Feed
- Get Direct Link
- Report Inappropriate Content
GraphBuilder Challenge
Created:
Mar 4, 2024 10:09 AM
| Last Modified: Mar 4, 2024 7:10 AM
(3011 views)
A Jmp graph with different Overlay categories - with a trick it's possible to create it:
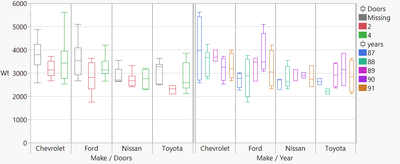
on the left: weight split by # doors
on the right: weight split by year.
Besides the trick, how can I use Overlay to create the graph?
dt = Open( "$SAMPLE_DATA/Cars.jmp" );
dt << New Column( "Count_Make",	Formula( Col Number( 1, :Make ) ));

dt << Graph Builder(
	Variables( X( :Make ), X( :Make ), Y( :Wt ), Overlay( :Year, :Doors ) ),
	Elements( Position( 1, 1 ), Box Plot( X, Y,Overlay( 2 ) ) ),
	Elements( Position( 2, 1 ), Box Plot( X, Y,Overlay( 1 ) ) ),
	Local Data Filter(
		Add Filter( columns( :Count_Make ), Where( :Count_Make >= 25 ) )
	)
)
3 REPLIES 3


Super User
- Mark as New
- Bookmark
- Subscribe
- Mute
- Subscribe to RSS Feed
- Get Direct Link
- Report Inappropriate Content
Re: GraphBuilder Challenge
Is it necessary to use Overlay (if you need coloring, color supports multiple columns but I would most likely just rely on X-axis having both categories visible)
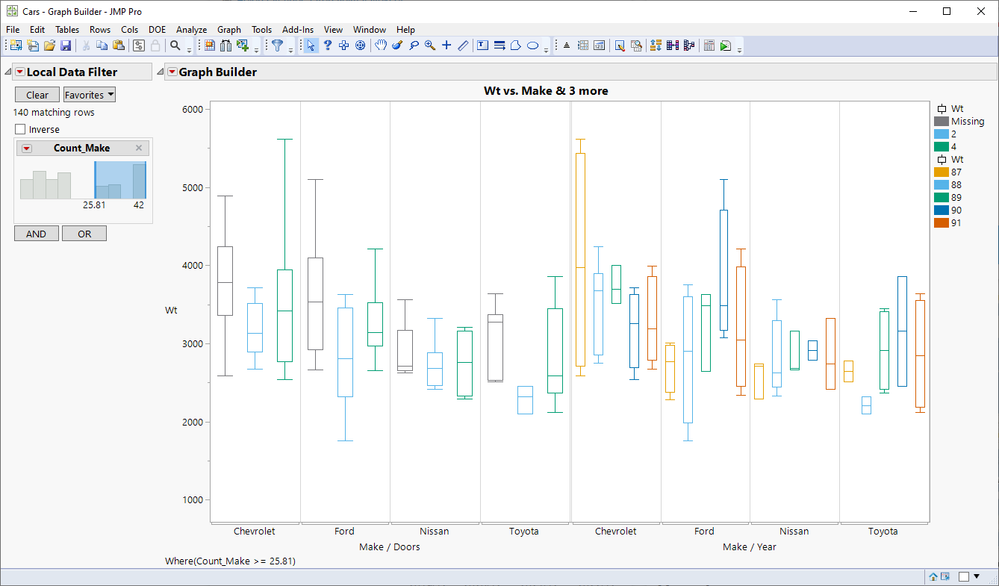
Graph Builder(
	Size(1024, 632),
	Show Control Panel(0),
	Include Missing Categories(1),
	Variables(X(:Make), X(:Doors, Position(1)), X(:Make), X(:Year, Position(2)), Y(:Wt), Color(:Doors), Color(:Year)),
	Elements(Position(1, 1), Box Plot(X(1), X(2), Y, Color(1), Legend(8))),
	Elements(Position(2, 1), Box Plot(X(1), X(2), Y, Color(2), Legend(3))),
	Local Data Filter(Add Filter(columns(:Count_Make), Where(:Count_Make >= 25.81))),
	SendToReport(
		Dispatch({}, "Make", ScaleBox, {Label Row(1, Show Major Labels(0)), Label Row(2, Show Major Grid(1))}),
		Dispatch({}, "Make", ScaleBox(2), {Label Row(1, Show Major Labels(0)), Label Row(2, Show Major Grid(1))})
	)
)
or without color
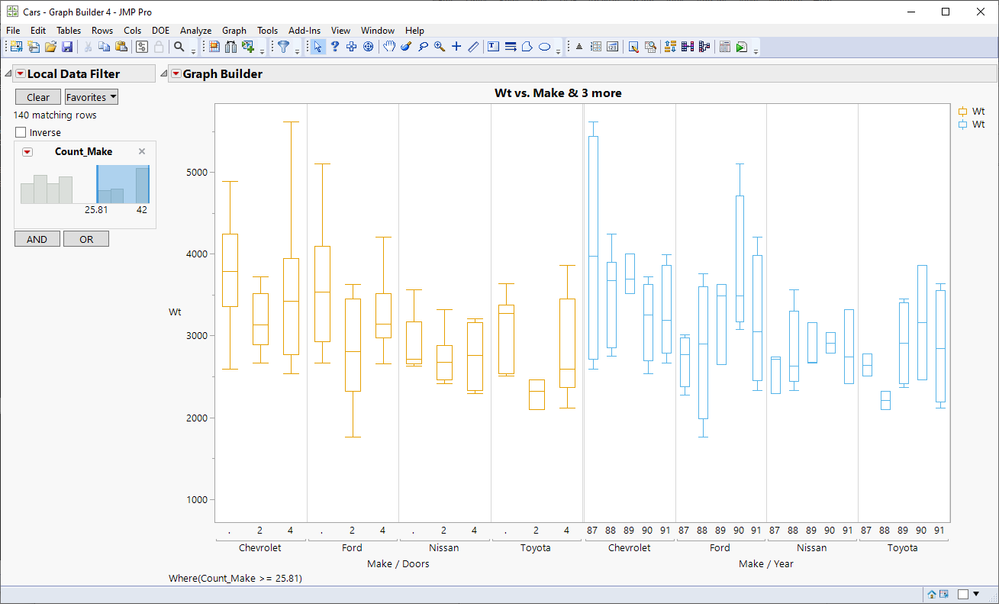
-Jarmo
Level XIII
- Mark as New
- Bookmark
- Subscribe
- Mute
- Subscribe to RSS Feed
- Get Direct Link
- Report Inappropriate Content
Re: GraphBuilder Challenge
Created:
Mar 4, 2024 11:32 AM
| Last Modified: Mar 9, 2025 3:23 AM
(2989 views)
| Posted in reply to message from jthi 03-04-2024
nice trick :)
and this one?
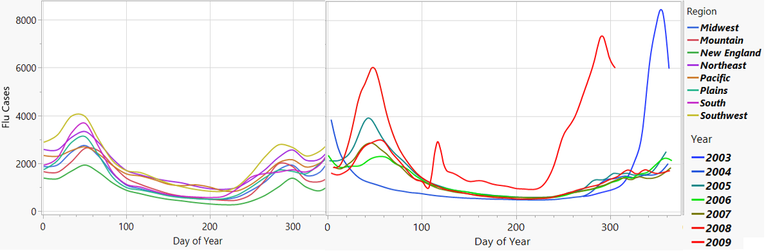
on the left: cases split by region
on the right: cases split by year
once Overlay by multiple columns is available, it will be:
dt = Open( "$SAMPLE_DATA/Seasonal Flu.jmp" );
dt << Graph Builder(
	Transform Column( "Year", Formula( Year( :Date ) ) ),
	Transform Column( "Day of Year", Formula( Day Of Year( :Date ) ) ),
	Variables(
		X( :Day of Year ),
		X( :Day of Year ),
		Y( :Flu Cases ),
		Overlay( :Year, :Region )
	),
	Elements(
		Position( 1, 1 ),
		Smoother( X, Y, Overlay( 2 ))
	),
	Elements( Position( 2, 1 ), Smoother( X, Y, Overlay( 1 )))
)
Level XIII
- Mark as New
- Bookmark
- Subscribe
- Mute
- Subscribe to RSS Feed
- Get Direct Link
- Report Inappropriate Content
Re: GraphBuilder Challenge
any idea?
Recommended Articles
- © 2026 JMP Statistical Discovery LLC. All Rights Reserved.
- Terms of Use
- Privacy Statement
- Contact Us