Turn on suggestions
Auto-suggest helps you quickly narrow down your search results by suggesting possible matches as you type.
- Don’t miss your chance to experience Discovery Summit Europe at our best available rate! Early bird registration through 31 Oct.
- Graph Builder Toolbar streamlines interactive graphing. Creates shortcuts on Report and GraphBuilder Helpers toolbars. Download and install the extension.
Options
- Subscribe to RSS Feed
- Mark Topic as New
- Mark Topic as Read
- Float this Topic for Current User
- Bookmark
- Subscribe
- Mute
- Printer Friendly Page
Discussions
Solve problems, and share tips and tricks with other JMP users.- User Community
- :
- Discussions
- :
- Graph builder - how to add max for x-axis and y-axis using script y-function

Level I
- Mark as New
- Bookmark
- Subscribe
- Mute
- Subscribe to RSS Feed
- Get Direct Link
- Report Inappropriate Content
Graph builder - how to add max for x-axis and y-axis using script y-function
Apr 28, 2020 03:30 PM
(5531 views)
I am using graph builder-scatter plot. and adding different trend lines with different constant. and i want to add max for both x-axis and y-axis. how can i do that?
7 REPLIES 7


Super User
- Mark as New
- Bookmark
- Subscribe
- Mute
- Subscribe to RSS Feed
- Get Direct Link
- Report Inappropriate Content
Re: Graph builder - how to add max for x-axis and y-axis using script y-function
You can get the max values for each of the Axes by
gb = Graph Builder( ………………………………. );

maxX = report(gb)[AxisBox(1)] << get max;
max& = report(gb)[AxisBox(2)] << get max;
It would be helpful to be more specific on how you are going to use the max values in a trend line.
Jim
Level I
- Mark as New
- Bookmark
- Subscribe
- Mute
- Subscribe to RSS Feed
- Get Direct Link
- Report Inappropriate Content
Re: Graph builder - how to add max for x-axis and y-axis using script y-function
First of all thanks for a very quick reply.
I want to basically show the trend line cut off for correlation purpose for x-axis and y-axis max allowable.
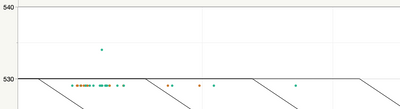
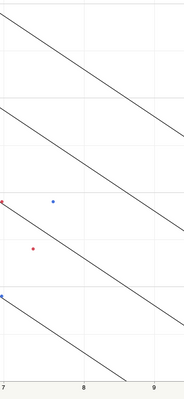
i was able to get the y-axis max (see picture how its maxed out at 530) but i cant figure out how to get the same for x-axis (I want to show max at 8).
i am using y function from script template.
I want to basically show the trend line cut off for correlation purpose for x-axis and y-axis max allowable.
i was able to get the y-axis max (see picture how its maxed out at 530) but i cant figure out how to get the same for x-axis (I want to show max at 8).
i am using y function from script template.
Super User
- Mark as New
- Bookmark
- Subscribe
- Mute
- Subscribe to RSS Feed
- Get Direct Link
- Report Inappropriate Content
Re: Graph builder - how to add max for x-axis and y-axis using script y-function
No picture in your response
Jim
Level I
- Mark as New
- Bookmark
- Subscribe
- Mute
- Subscribe to RSS Feed
- Get Direct Link
- Report Inappropriate Content
Re: Graph builder - how to add max for x-axis and y-axis using script y-function
not sure why-heres the picture again-sorry about that.
Super User
- Mark as New
- Bookmark
- Subscribe
- Mute
- Subscribe to RSS Feed
- Get Direct Link
- Report Inappropriate Content
Re: Graph builder - how to add max for x-axis and y-axis using script y-function
Why isn't this what you need, in getting the max values for each axis?
Names Default To Here( 1 );
dt = Open( "$SAMPLE_DATA/big class.jmp" );
gb = dt << Graph Builder(
	Variables( X( :weight ), Y( :height ) ),
	Elements( Points( X, Y, Legend( 6 ) ) )
);

show(report(gb)[AxisBox(1)] << get max,
	report(gb)[AxisBox(2)] << get max
);
Jim
Level I
- Mark as New
- Bookmark
- Subscribe
- Mute
- Subscribe to RSS Feed
- Get Direct Link
- Report Inappropriate Content
Re: Graph builder - how to add max for x-axis and y-axis using script y-function
I am not sure-I can give it a try - but i wanted to know if my existing script derived from y function can be modified to set max for x-axis. heres the equation i am using Y Function (Min(C - M*X), 530 ), x );
-thanks much. appreciate your help and be safe.
-thanks much. appreciate your help and be safe.
Super User
- Mark as New
- Bookmark
- Subscribe
- Mute
- Subscribe to RSS Feed
- Get Direct Link
- Report Inappropriate Content
Re: Graph builder - how to add max for x-axis and y-axis using script y-function
I think all you are asking for is:
x = report(gb)[AxisBox(1)] << get max;
Jim
Recommended Articles
- © 2026 JMP Statistical Discovery LLC. All Rights Reserved.
- Terms of Use
- Privacy Statement
- Contact Us