- Subscribe to RSS Feed
- Mark Topic as New
- Mark Topic as Read
- Float this Topic for Current User
- Bookmark
- Subscribe
- Mute
- Printer Friendly Page
Discussions
Solve problems, and share tips and tricks with other JMP users.- JMP User Community
- :
- Discussions
- :
- Graph builder: can we plot X-axis data unsorted?

- Mark as New
- Bookmark
- Subscribe
- Mute
- Subscribe to RSS Feed
- Get Direct Link
- Report Inappropriate Content
Graph builder: can we plot X-axis data unsorted?
Hello, three questions for legacy overlay plot (LOP) vs graph builder (GB), please.
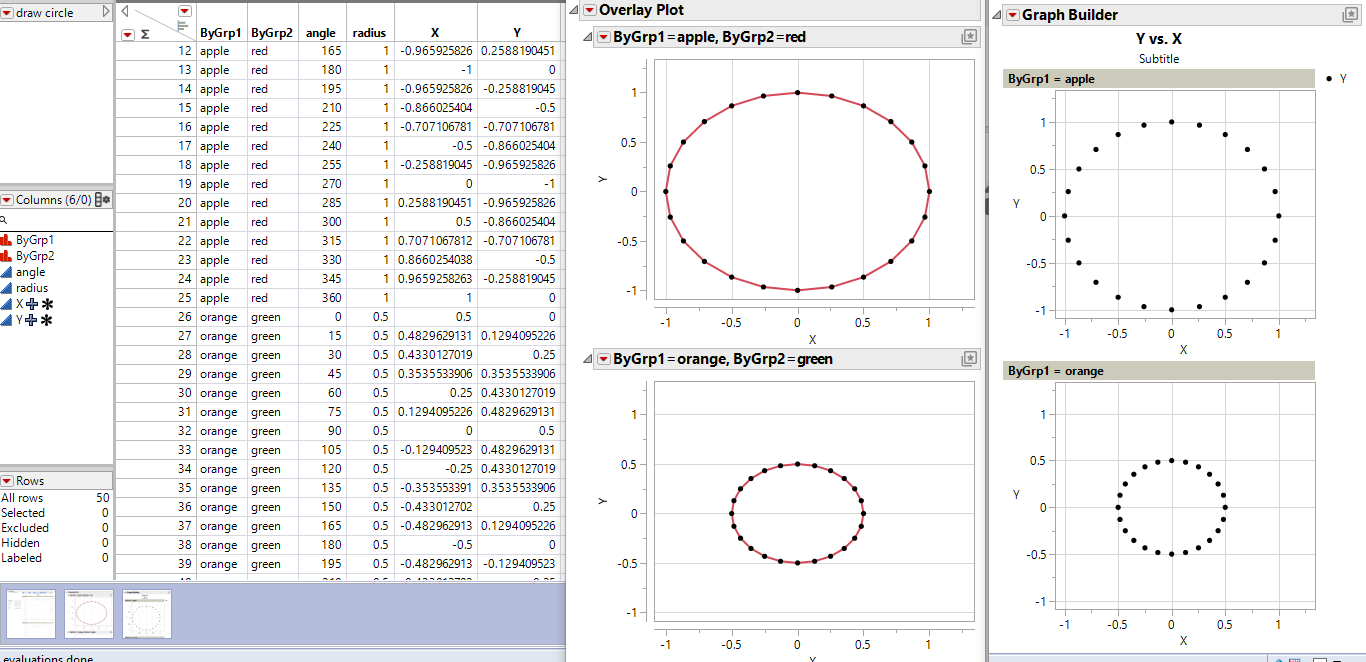
Q1) with LOP there is the option to uncheck "sort x". Example data below, where I'm looking to plot points on a circle and connect the points. Is there an equivalent to do that in GB? I believe I tried most of the GB options but must have missed it.
Q2) LOP has option to "Connect points". For GB, I found the closest would be to enable smoother, with smallest Lambda. Is there an equivalent?
Q2) with LOP I could put multiple columns in the "By" role. In GB I could only ever put one column in the "By" role. Am I again missing something?
Thank you in advance for feedback!
(P.S. also noted JMP18 still supports JSL implementation of LOP, but the Scripting Index removed all references to it :D )
Accepted Solutions

- Mark as New
- Bookmark
- Subscribe
- Mute
- Subscribe to RSS Feed
- Get Direct Link
- Report Inappropriate Content
Re: Graph builder: can we plot X-axis data unsorted?
You can enable row order and use line plot with the points

With graph builder you can for example use Overlay, Page or By. By can be found from Control Panel / Redo / Relaunch analysis

- Mark as New
- Bookmark
- Subscribe
- Mute
- Subscribe to RSS Feed
- Get Direct Link
- Report Inappropriate Content
Re: Graph builder: can we plot X-axis data unsorted?
You can enable row order and use line plot with the points
With graph builder you can for example use Overlay, Page or By. By can be found from Control Panel / Redo / Relaunch analysis
- Mark as New
- Bookmark
- Subscribe
- Mute
- Subscribe to RSS Feed
- Get Direct Link
- Report Inappropriate Content
Re: Graph builder: can we plot X-axis data unsorted?
Thank you!! TIL about the Line row order option!
Also to share about using the Shift key to enable both "Line" and "Points" together!
- Mark as New
- Bookmark
- Subscribe
- Mute
- Subscribe to RSS Feed
- Get Direct Link
- Report Inappropriate Content
Re: Graph builder: can we plot X-axis data unsorted?
That shift thing is mentioned here https://www.jmp.com/support/help/en/18.0/#page/jmp/example-of-an-area-and-line-chart.shtml . You can also drag and drop those different types of graphs to the specific areas from the "graph" toolbar

Recommended Articles
- © 2026 JMP Statistical Discovery LLC. All Rights Reserved.
- Terms of Use
- Privacy Statement
- Contact Us