- Don’t miss your chance to experience Discovery Summit Europe at our best available rate! Early bird registration through 31 Oct.
- Graph Builder Toolbar streamlines interactive graphing. Creates shortcuts on Report and GraphBuilder Helpers toolbars. Download and install the extension.
- JMP will suspend normal business operations for our Rest and Recharge Day on Friday, October 2, 2026.
Regular business hours will resume on Monday, October 5, 2026.
- Subscribe to RSS Feed
- Mark Topic as New
- Mark Topic as Read
- Float this Topic for Current User
- Bookmark
- Subscribe
- Mute
- Printer Friendly Page
Discussions
Solve problems, and share tips and tricks with other JMP users.- User Community
- :
- Discussions
- :
- Re: Graph Builder

- Mark as New
- Bookmark
- Subscribe
- Mute
- Subscribe to RSS Feed
- Get Direct Link
- Report Inappropriate Content
Graph Builder
Hello
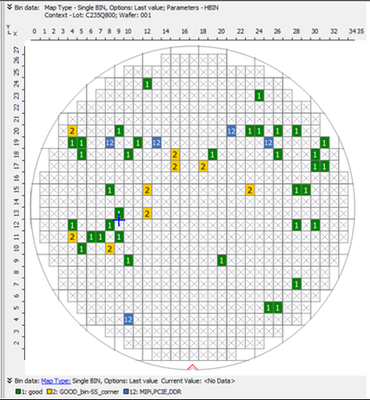
I have data that included Die X and Die Y and which BIN was FAIL or PASS
I understand this graph I should create this by Graph Builder
but I tried to do it and I did receive so beautiful result or something close to it.
so I have a few questions
1) How I can create the demo of the circle wafer
2) how I can note X in a place where I do not have data for this unit
3) Color and square shape I believe I can do it in the database by color rows and in markers
I provide the example that I see other people do (not in JMP), so my question is if by JMP I can do something similar to this?


- Mark as New
- Bookmark
- Subscribe
- Mute
- Subscribe to RSS Feed
- Get Direct Link
- Report Inappropriate Content
Re: Graph Builder
Shape files, using heatmaps/points plot, background image/map or graphic scripts are some options you have with JMP.
- Mark as New
- Bookmark
- Subscribe
- Mute
- Subscribe to RSS Feed
- Get Direct Link
- Report Inappropriate Content
Re: Graph Builder
Hello
so If I understood well, I could create the graph like this only
So my question is if I can add inside of the square shape the number of errors from the database (bin)?

- Mark as New
- Bookmark
- Subscribe
- Mute
- Subscribe to RSS Feed
- Get Direct Link
- Report Inappropriate Content
Re: Graph Builder
With large enough graph you can do something like this

You can do something a bit similar when using Shape Files but I think then you have to use Label row state and column property (and maybe summary table)
Recommended Articles
- © 2026 JMP Statistical Discovery LLC. All Rights Reserved.
- Terms of Use
- Privacy Statement
- Contact Us