- JMP Statement Regarding Critical PHP Remote Code Execution Vulnerabilities (CVE-2026-109618, CVE-2026-109619)
- Don’t miss your chance to experience Discovery Summit Europe at our best available rate! Early bird registration through 31 Oct.
- Graph Builder Toolbar streamlines interactive graphing. Creates shortcuts on Report and GraphBuilder Helpers toolbars. Download and install the extension.
- Subscribe to RSS Feed
- Mark Topic as New
- Mark Topic as Read
- Float this Topic for Current User
- Bookmark
- Subscribe
- Mute
- Printer Friendly Page
Discussions
Solve problems, and share tips and tricks with other JMP users.- User Community
- :
- Discussions
- :
- Re: Graph Builder > Spaghetti Plot With Average: How to create without Customiza...


- Mark as New
- Bookmark
- Subscribe
- Mute
- Subscribe to RSS Feed
- Get Direct Link
- Report Inappropriate Content
Graph Builder > Spaghetti Plot With Average: How to create without Customization?
Hi JMP Community,
I'm trying to produce a large number of "spaghetti plots" with average lines for 3 categories as shown below but the only way I was able to build this example is by using a Custom Graphics Script: Is there a way to produce this graph more efficiently by for example combining more than 1 overlay criteria? Also, what is the proper syntax to assign specific color to the Markers added in the Graphics Script?
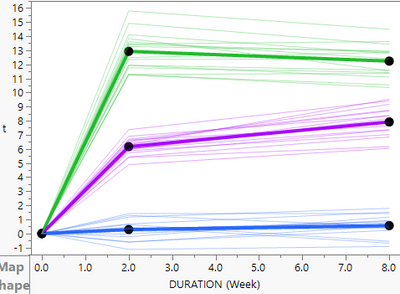
//Graphics Script Associated with Plot Above
Pen Size( 4 );
Marker Size( 8 );
Pen Color( blue );
Line( {0, 0}, {2.0, 0.284}, {8.0, 0.564} );
Marker( {0, 0}, {2.0, 0.284}, {8.0, 0.564} );
Pen Color( green );
Line( {0, 0}, {2.0, 12.93}, {8.0, 12.24} );
Marker( {0, 0}, {2.0, 12.93}, {8.0, 12.24} );
Pen Color( purple );
Line( {0, 0}, {2.0, 6.17}, {8.0, 7.92} );
Marker( {0, 0}, {2.0, 6.17}, {8.0, 7.92} );
Thank you for your help.
Best,
TS
Accepted Solutions

- Mark as New
- Bookmark
- Subscribe
- Mute
- Subscribe to RSS Feed
- Get Direct Link
- Report Inappropriate Content
Re: Graph Builder > Spaghetti Plot With Average: How to create without Customization?
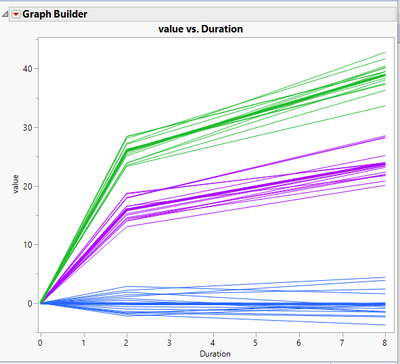
Below is a hard wired version of your graph(close to your version that is). The hardwired part could be generalized without much effort. I hope you find it useful, and if not, at least amusing
Names Default To Here( 1 );
dt = New Table( "Example",
	New Column( "Group", character ),
	New Column( "Run" ),
	New Column( "Duration" ),
	New Column( "value" )
);

For( g = 1, g <= 3, g++,
	For( r = 1, r <= 15, r++,
		dt << add rows( 1 );
		dt:value[N Rows( dt )] = 0;
		dt:Duration[N Rows( dt )] = 0;
		dt:group[N Rows( dt )] = "Group " || Char( g );
		dt:run[N Rows( dt )] = r;
	)
);

For( g = 1, g <= 3, g++,
	If(
		g == 1, a = 0,
		g == 2, a = 8,
		a = 13
	);

	For( r = 1, r <= 15, r++,
		d = 2;
		dt << add rows( 1 );
		dt:value[N Rows( dt )] = a + Random Uniform( a - 3, a + 3 );
		dt:Duration[N Rows( dt )] = d;
		dt:group[N Rows( dt )] = "Group " || Char( g );
		dt:run[N Rows( dt )] = r;
		dt << add rows( 1 );
		d = 8;
		dt:run[N Rows( dt )] = r;
		dt:value[N Rows( dt )] = dt:value[N Rows( dt ) - 1] + Random Uniform( a - 3, a + 3 );
		dt:Duration[N Rows( dt )] = d;
		dt:group[N Rows( dt )] = "Group " || Char( g );

	);
);

dt << new column( "Group Run", character, set each value(:Group || " " || char( :run )));

dt:group run << set property(
	"value colors",
	{"Group 1 1" = blue, "Group 1 2" = blue, "Group 1 3" = blue, "Group 1 4" = blue,
	"Group 1 5" = blue, "Group 1 6" = blue, "Group 1 7" = blue, "Group 1 8" = blue,
	"Group 1 9" = blue, "Group 1 10" = blue, "Group 1 11" = blue, "Group 1 12" = blue, "Group 1 13"
	 = blue, "Group 1 14" = blue, "Group 1 15" = blue, "Mean 1 1" = blue, "Group 2 1" = purple, "Group 2 2" = purple, "Group 2 3"
	 = purple, "Group 2 4" = purple, "Group 2 5" = purple, "Group 2 6" = purple, "Group 2 7" =
	purple, "Group 2 8" = purple, "Group 2 9" = purple, "Group 2 10" = purple, "Group 2 11" =
	purple, "Group 2 12" = purple, "Group 2 13" = purple, "Group 2 14" = purple, "Group 2 15" =
	purple, "Mean 2 1" = purple, "Group 3 1" = green, "Group 3 2" = green, "Group 3 3" = green, "Group 3 4" = green,
	"Group 3 5" = green, "Group 3 6" = green, "Group 3 7" = green, "Group 3 8" = green,
	"Group 3 9" = green, "Group 3 10" = green, "Group 3 11" = green, "Group 3 12" = green,
	"Group 3 13" = green, "Group 3 14" = green, "Group 3 15" = green, "Mean 3 1" = green }
);

dtSum = dt << Summary(
	Group( :Group, :Duration ),
	Mean( :value ),
	Freq( "None" ),
	Weight( "None" ),
	statistics column name format( "column" ),
	Link to original data table( 0 )
);

dtSum << delete columns(:N Rows);
dtSum << New Column("Group Run",
	character, set each value("Mean " || char(word(2, :Group)) || " 1")
);

dtFinal = dt << Concatenate(dtSum
);

gb = Graph Builder(
	Variables( X( :Duration ), Y( :value ), Overlay( :Group Run ) ),
	Elements( Line( X, Y, Legend( 7 ) ) ),
	show control panel( 0 ),
	SendToReport(
		Dispatch(
			{},
			"400",
			ScaleBox,
			{Legend Model(
				7,
				Properties( 0, {Line Width( 1 )}, Item ID( "Group 1 1", 1 ) ),
				Properties( 1, {Line Width( 1 )}, Item ID( "Group 1 2", 1 ) ),
				Properties( 2, {Line Width( 1 )}, Item ID( "Group 1 3", 1 ) ),
				Properties( 3, {Line Width( 1 )}, Item ID( "Group 1 4", 1 ) ),
				Properties( 4, {Line Width( 1 )}, Item ID( "Group 1 5", 1 ) ),
				Properties( 5, {Line Width( 1 )}, Item ID( "Group 1 6", 1 ) ),
				Properties( 6, {Line Width( 1 )}, Item ID( "Group 1 7", 1 ) ),
				Properties( 7, {Line Width( 1 )}, Item ID( "Group 1 8", 1 ) ),
				Properties( 8, {Line Width( 1 )}, Item ID( "Group 1 9", 1 ) ),
				Properties( 9, {Line Width( 1 )}, Item ID( "Group 1 10", 1 ) ),
				Properties( 10, {Line Width( 1 )}, Item ID( "Group 1 11", 1 ) ),
				Properties( 11, {Line Width( 1 )}, Item ID( "Group 1 12", 1 ) ),
				Properties( 12, {Line Width( 1 )}, Item ID( "Group 1 13", 1 ) ),
				Properties( 13, {Line Width( 1 )}, Item ID( "Group 1 14", 1 ) ),
				Properties( 14, {Line Width( 1 )}, Item ID( "Group 1 15", 1 ) ),
				Properties( 15, {Line Width( 1 )}, Item ID( "Group 2 1", 1 ) ),
				Properties( 16, {Line Width( 1 )}, Item ID( "Group 2 2", 1 ) ),
				Properties( 17, {Line Width( 1 )}, Item ID( "Group 2 3", 1 ) ),
				Properties( 18, {Line Width( 1 )}, Item ID( "Group 2 4", 1 ) ),
				Properties( 19, {Line Width( 1 )}, Item ID( "Group 2 5", 1 ) ),
				Properties( 20, {Line Width( 1 )}, Item ID( "Group 2 6", 1 ) ),
				Properties( 21, {Line Width( 1 )}, Item ID( "Group 2 7", 1 ) ),
				Properties( 22, {Line Width( 1 )}, Item ID( "Group 2 8", 1 ) ),
				Properties( 23, {Line Width( 1 )}, Item ID( "Group 2 9", 1 ) ),
				Properties( 24, {Line Width( 1 )}, Item ID( "Group 2 10", 1 ) ),
				Properties( 25, {Line Width( 1 )}, Item ID( "Group 2 11", 1 ) ),
				Properties( 26, {Line Width( 1 )}, Item ID( "Group 2 12", 1 ) ),
				Properties( 27, {Line Width( 1 )}, Item ID( "Group 2 13", 1 ) ),
				Properties( 28, {Line Width( 1 )}, Item ID( "Group 2 14", 1 ) ),
				Properties( 29, {Line Width( 1 )}, Item ID( "Group 2 15", 1 ) ),
				Properties( 30, {Line Width( 1 )}, Item ID( "Group 3 1", 1 ) ),
				Properties( 31, {Line Width( 1 )}, Item ID( "Group 3 2", 1 ) ),
				Properties( 32, {Line Width( 1 )}, Item ID( "Group 3 3", 1 ) ),
				Properties( 33, {Line Width( 1 )}, Item ID( "Group 3 4", 1 ) ),
				Properties( 34, {Line Width( 1 )}, Item ID( "Group 3 5", 1 ) ),
				Properties( 35, {Line Width( 1 )}, Item ID( "Group 3 6", 1 ) ),
				Properties( 36, {Line Width( 1 )}, Item ID( "Group 3 7", 1 ) ),
				Properties( 37, {Line Width( 1 )}, Item ID( "Group 3 8", 1 ) ),
				Properties( 38, {Line Width( 1 )}, Item ID( "Group 3 9", 1 ) ),
				Properties( 39, {Line Width( 1 )}, Item ID( "Group 3 10", 1 ) ),
				Properties( 40, {Line Width( 1 )}, Item ID( "Group 3 11", 1 ) ),
				Properties( 41, {Line Width( 1 )}, Item ID( "Group 3 12", 1 ) ),
				Properties( 42, {Line Width( 1 )}, Item ID( "Group 3 13", 1 ) ),
				Properties( 43, {Line Width( 1 )}, Item ID( "Group 3 14", 1 ) ),
				Properties( 44, {Line Width( 1 )}, Item ID( "Group 3 15", 1 ) ),
				Properties( 45, {Line Width( 4 )}, Item ID( "Mean 1 1", 1 ) ),
				Properties( 46, {Line Width( 4 )}, Item ID( "Mean 2 1", 1 ) ),
				Properties( 47, {Line Width( 4 )}, Item ID( "Mean 3 1", 1 ) )
			)}
)));

report(gb)[LegendBox(1)]<<visibility("collapse");
- Mark as New
- Bookmark
- Subscribe
- Mute
- Subscribe to RSS Feed
- Get Direct Link
- Report Inappropriate Content
Re: Graph Builder > Spaghetti Plot With Average: How to create without Customization?
Below is a hard wired version of your graph(close to your version that is). The hardwired part could be generalized without much effort. I hope you find it useful, and if not, at least amusing
Names Default To Here( 1 );
dt = New Table( "Example",
	New Column( "Group", character ),
	New Column( "Run" ),
	New Column( "Duration" ),
	New Column( "value" )
);

For( g = 1, g <= 3, g++,
	For( r = 1, r <= 15, r++,
		dt << add rows( 1 );
		dt:value[N Rows( dt )] = 0;
		dt:Duration[N Rows( dt )] = 0;
		dt:group[N Rows( dt )] = "Group " || Char( g );
		dt:run[N Rows( dt )] = r;
	)
);

For( g = 1, g <= 3, g++,
	If(
		g == 1, a = 0,
		g == 2, a = 8,
		a = 13
	);

	For( r = 1, r <= 15, r++,
		d = 2;
		dt << add rows( 1 );
		dt:value[N Rows( dt )] = a + Random Uniform( a - 3, a + 3 );
		dt:Duration[N Rows( dt )] = d;
		dt:group[N Rows( dt )] = "Group " || Char( g );
		dt:run[N Rows( dt )] = r;
		dt << add rows( 1 );
		d = 8;
		dt:run[N Rows( dt )] = r;
		dt:value[N Rows( dt )] = dt:value[N Rows( dt ) - 1] + Random Uniform( a - 3, a + 3 );
		dt:Duration[N Rows( dt )] = d;
		dt:group[N Rows( dt )] = "Group " || Char( g );

	);
);

dt << new column( "Group Run", character, set each value(:Group || " " || char( :run )));

dt:group run << set property(
	"value colors",
	{"Group 1 1" = blue, "Group 1 2" = blue, "Group 1 3" = blue, "Group 1 4" = blue,
	"Group 1 5" = blue, "Group 1 6" = blue, "Group 1 7" = blue, "Group 1 8" = blue,
	"Group 1 9" = blue, "Group 1 10" = blue, "Group 1 11" = blue, "Group 1 12" = blue, "Group 1 13"
	 = blue, "Group 1 14" = blue, "Group 1 15" = blue, "Mean 1 1" = blue, "Group 2 1" = purple, "Group 2 2" = purple, "Group 2 3"
	 = purple, "Group 2 4" = purple, "Group 2 5" = purple, "Group 2 6" = purple, "Group 2 7" =
	purple, "Group 2 8" = purple, "Group 2 9" = purple, "Group 2 10" = purple, "Group 2 11" =
	purple, "Group 2 12" = purple, "Group 2 13" = purple, "Group 2 14" = purple, "Group 2 15" =
	purple, "Mean 2 1" = purple, "Group 3 1" = green, "Group 3 2" = green, "Group 3 3" = green, "Group 3 4" = green,
	"Group 3 5" = green, "Group 3 6" = green, "Group 3 7" = green, "Group 3 8" = green,
	"Group 3 9" = green, "Group 3 10" = green, "Group 3 11" = green, "Group 3 12" = green,
	"Group 3 13" = green, "Group 3 14" = green, "Group 3 15" = green, "Mean 3 1" = green }
);

dtSum = dt << Summary(
	Group( :Group, :Duration ),
	Mean( :value ),
	Freq( "None" ),
	Weight( "None" ),
	statistics column name format( "column" ),
	Link to original data table( 0 )
);

dtSum << delete columns(:N Rows);
dtSum << New Column("Group Run",
	character, set each value("Mean " || char(word(2, :Group)) || " 1")
);

dtFinal = dt << Concatenate(dtSum
);

gb = Graph Builder(
	Variables( X( :Duration ), Y( :value ), Overlay( :Group Run ) ),
	Elements( Line( X, Y, Legend( 7 ) ) ),
	show control panel( 0 ),
	SendToReport(
		Dispatch(
			{},
			"400",
			ScaleBox,
			{Legend Model(
				7,
				Properties( 0, {Line Width( 1 )}, Item ID( "Group 1 1", 1 ) ),
				Properties( 1, {Line Width( 1 )}, Item ID( "Group 1 2", 1 ) ),
				Properties( 2, {Line Width( 1 )}, Item ID( "Group 1 3", 1 ) ),
				Properties( 3, {Line Width( 1 )}, Item ID( "Group 1 4", 1 ) ),
				Properties( 4, {Line Width( 1 )}, Item ID( "Group 1 5", 1 ) ),
				Properties( 5, {Line Width( 1 )}, Item ID( "Group 1 6", 1 ) ),
				Properties( 6, {Line Width( 1 )}, Item ID( "Group 1 7", 1 ) ),
				Properties( 7, {Line Width( 1 )}, Item ID( "Group 1 8", 1 ) ),
				Properties( 8, {Line Width( 1 )}, Item ID( "Group 1 9", 1 ) ),
				Properties( 9, {Line Width( 1 )}, Item ID( "Group 1 10", 1 ) ),
				Properties( 10, {Line Width( 1 )}, Item ID( "Group 1 11", 1 ) ),
				Properties( 11, {Line Width( 1 )}, Item ID( "Group 1 12", 1 ) ),
				Properties( 12, {Line Width( 1 )}, Item ID( "Group 1 13", 1 ) ),
				Properties( 13, {Line Width( 1 )}, Item ID( "Group 1 14", 1 ) ),
				Properties( 14, {Line Width( 1 )}, Item ID( "Group 1 15", 1 ) ),
				Properties( 15, {Line Width( 1 )}, Item ID( "Group 2 1", 1 ) ),
				Properties( 16, {Line Width( 1 )}, Item ID( "Group 2 2", 1 ) ),
				Properties( 17, {Line Width( 1 )}, Item ID( "Group 2 3", 1 ) ),
				Properties( 18, {Line Width( 1 )}, Item ID( "Group 2 4", 1 ) ),
				Properties( 19, {Line Width( 1 )}, Item ID( "Group 2 5", 1 ) ),
				Properties( 20, {Line Width( 1 )}, Item ID( "Group 2 6", 1 ) ),
				Properties( 21, {Line Width( 1 )}, Item ID( "Group 2 7", 1 ) ),
				Properties( 22, {Line Width( 1 )}, Item ID( "Group 2 8", 1 ) ),
				Properties( 23, {Line Width( 1 )}, Item ID( "Group 2 9", 1 ) ),
				Properties( 24, {Line Width( 1 )}, Item ID( "Group 2 10", 1 ) ),
				Properties( 25, {Line Width( 1 )}, Item ID( "Group 2 11", 1 ) ),
				Properties( 26, {Line Width( 1 )}, Item ID( "Group 2 12", 1 ) ),
				Properties( 27, {Line Width( 1 )}, Item ID( "Group 2 13", 1 ) ),
				Properties( 28, {Line Width( 1 )}, Item ID( "Group 2 14", 1 ) ),
				Properties( 29, {Line Width( 1 )}, Item ID( "Group 2 15", 1 ) ),
				Properties( 30, {Line Width( 1 )}, Item ID( "Group 3 1", 1 ) ),
				Properties( 31, {Line Width( 1 )}, Item ID( "Group 3 2", 1 ) ),
				Properties( 32, {Line Width( 1 )}, Item ID( "Group 3 3", 1 ) ),
				Properties( 33, {Line Width( 1 )}, Item ID( "Group 3 4", 1 ) ),
				Properties( 34, {Line Width( 1 )}, Item ID( "Group 3 5", 1 ) ),
				Properties( 35, {Line Width( 1 )}, Item ID( "Group 3 6", 1 ) ),
				Properties( 36, {Line Width( 1 )}, Item ID( "Group 3 7", 1 ) ),
				Properties( 37, {Line Width( 1 )}, Item ID( "Group 3 8", 1 ) ),
				Properties( 38, {Line Width( 1 )}, Item ID( "Group 3 9", 1 ) ),
				Properties( 39, {Line Width( 1 )}, Item ID( "Group 3 10", 1 ) ),
				Properties( 40, {Line Width( 1 )}, Item ID( "Group 3 11", 1 ) ),
				Properties( 41, {Line Width( 1 )}, Item ID( "Group 3 12", 1 ) ),
				Properties( 42, {Line Width( 1 )}, Item ID( "Group 3 13", 1 ) ),
				Properties( 43, {Line Width( 1 )}, Item ID( "Group 3 14", 1 ) ),
				Properties( 44, {Line Width( 1 )}, Item ID( "Group 3 15", 1 ) ),
				Properties( 45, {Line Width( 4 )}, Item ID( "Mean 1 1", 1 ) ),
				Properties( 46, {Line Width( 4 )}, Item ID( "Mean 2 1", 1 ) ),
				Properties( 47, {Line Width( 4 )}, Item ID( "Mean 3 1", 1 ) )
			)}
)));

report(gb)[LegendBox(1)]<<visibility("collapse");


- Mark as New
- Bookmark
- Subscribe
- Mute
- Subscribe to RSS Feed
- Get Direct Link
- Report Inappropriate Content
Re: Graph Builder > Spaghetti Plot With Average: How to create without Customization?
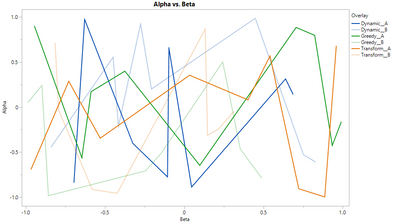
I think you could do this with a single overlay criteria that had 6 levels: blue dark, blue light, etc.. Then customize color with the legend.
Script:
Names default to here(1);

dt = Open("$Sample_data\Design Experiment\Algorithm Data.jmp");

dt << New Column("Overlay", Character, "Nominal", Formula(:Algorithm || "__" || :Compiler));

dt << Graph Builder(
	Size( 834, 534 ),
	Show Control Panel( 0 ),
	Variables( X( :Beta ), Y( :Alpha ), Overlay( :Overlay ) ),
	Elements( Line( X, Y, Legend( 10 ) ) ),
	SendToReport(
		Dispatch(
			{},
			"400",
			ScaleBox,
			{Legend Model(
				10,
				Properties( 0, {Line Color( 53 )}, Item ID( "Dynamic__A", 1 ) ),
				Properties(
					1,
					{Line Color( 53 ), Transparency( 0.3 )},
					Item ID( "Dynamic__B", 1 )
				),
				Properties( 2, {Line Color( 20 )}, Item ID( "Greedy__A", 1 ) ),
				Properties(
					3,
					{Line Color( 20 ), Transparency( 0.3 )},
					Item ID( "Greedy__B", 1 )
				),
				Properties( 4, {Line Color( 6 )}, Item ID( "Transform__A", 1 ) ),
				Properties(
					5,
					{Line Color( 6 ), Transparency( 0.3 )},
					Item ID( "Transform__B", 1 )
				)
			)}
		)
	)
);
Recommended Articles
- © 2026 JMP Statistical Discovery LLC. All Rights Reserved.
- Terms of Use
- Privacy Statement
- Contact Us