- JMP Statement Regarding Critical PHP Remote Code Execution Vulnerabilities (CVE-2026-109618, CVE-2026-109619)
- Don’t miss your chance to experience Discovery Summit Europe at our best available rate! Early bird registration through 31 Oct.
- Graph Builder Toolbar streamlines interactive graphing. Creates shortcuts on Report and GraphBuilder Helpers toolbars. Download and install the extension.
- Subscribe to RSS Feed
- Mark Topic as New
- Mark Topic as Read
- Float this Topic for Current User
- Bookmark
- Subscribe
- Mute
- Printer Friendly Page
Discussions
Solve problems, and share tips and tricks with other JMP users.- User Community
- :
- Discussions
- :
- Graph Builder composite graphs

- Mark as New
- Bookmark
- Subscribe
- Mute
- Subscribe to RSS Feed
- Get Direct Link
- Report Inappropriate Content
Graph Builder composite graphs
In Graph Builder, I would like to create a composite graph consisting of four panes in a 2x2 arrangment. I'd like each of the panes to have a different y-axis, whereas both have the same x-scale. I can get to 2 rows x 1 column with overlays.
But when I double up the x axis, I'd like the overlay to go away, so I just have a single parameter in each pane. Instead I get this:
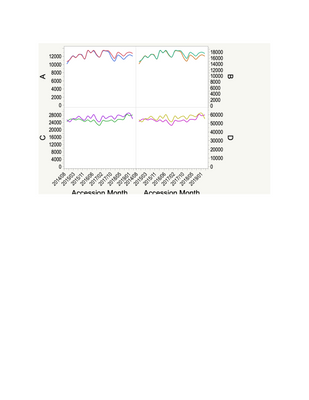
Is there a way to get 2 x 2 panes with just one column plotted in each pane (i.e. no overlay)?
John


- Mark as New
- Bookmark
- Subscribe
- Mute
- Subscribe to RSS Feed
- Get Direct Link
- Report Inappropriate Content
Re: Graph Builder composite graphs
Here is an example using JSL.
Names Default to Here(1);
dt = Open("$sample_data/fitness.jmp");


gb = dt << Graph Builder(
	Size( 534, 454 ),
	Show Control Panel( 0 ),
	Variables(
		X( :Weight ),
		X( :Weight ),
		Y( :Oxy, Side( "Right" ) ),
		Y( :Runtime, Position( 1 ) ),
		Y( :RunPulse ),
		Y( :RstPulse, Position( 2 ), Side( "Right" ) ),
		Overlay( :Sex )
	),
	Elements(
		Position( 1, 1 ),
		Points( X, Y( 2 ), Legend( 240 ) ),
		Smoother( X, Y( 2 ), Legend( 241 ) )
	),
	Elements(
		Position( 1, 2 ),
		Points( X, Y( 2 ), Legend( 246 ) ),
		Smoother( X, Y( 2 ), Legend( 247 ) )
	),
	Elements(
		Position( 2, 1 ),
		Points( X, Y( 2 ), Legend( 248 ) ),
		Smoother( X, Y( 2 ), Legend( 249 ) )
	),
	Elements(
		Position( 2, 2 ),
		Points( X, Y( 2 ), Legend( 254 ) ),
		Smoother( X, Y( 2 ), Legend( 255 ) )
	)
);
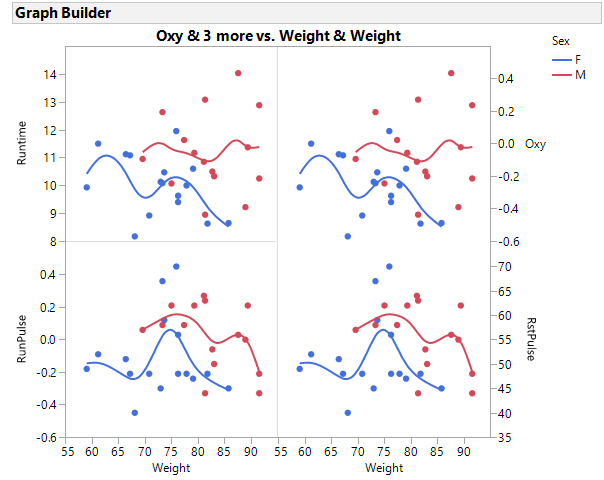


 Community Manager
- Mark as New
- Bookmark
- Subscribe
- Mute
- Subscribe to RSS Feed
- Get Direct Link
- Report Inappropriate Content
Re: Graph Builder composite graphs
Hi @john_madden ,
Extending on the JSL script provided by @gzmorgan0 with the same fitness data table.
If you right-click on the axis you get an option to move the variable to the right.
You can also move the axis back with a right-click on the right-most axis and selecting move left.
And here is a video showing the interactive steps to move the y-axis to the right.
cheers,
Stan
Recommended Articles
- © 2026 JMP Statistical Discovery LLC. All Rights Reserved.
- Terms of Use
- Privacy Statement
- Contact Us