Turn on suggestions
Auto-suggest helps you quickly narrow down your search results by suggesting possible matches as you type.
Options
- Subscribe to RSS Feed
- Mark Topic as New
- Mark Topic as Read
- Float this Topic for Current User
- Bookmark
- Subscribe
- Mute
- Printer Friendly Page
Discussions
Solve problems, and share tips and tricks with other JMP users.- JMP User Community
- :
- Discussions
- :
- Graph Builder commulative counts of events
- Mark as New
- Bookmark
- Subscribe
- Mute
- Subscribe to RSS Feed
- Get Direct Link
- Report Inappropriate Content
Graph Builder commulative counts of events
Created:
Jul 19, 2020 05:27 AM
| Last Modified: Jun 11, 2023 4:03 AM
(3173 views)
How to make simple line graph of commutative occurrences of events month to month? ie month2 = monthe1+month2 etc.
thanks
1 ACCEPTED SOLUTION
Accepted Solutions
- Mark as New
- Bookmark
- Subscribe
- Mute
- Subscribe to RSS Feed
- Get Direct Link
- Report Inappropriate Content
Re: Graph Builder commulative counts of events
Created:
Jul 20, 2020 05:41 AM
| Last Modified: Jul 20, 2020 3:02 AM
(3135 views)
| Posted in reply to message from RonB 07-20-2020
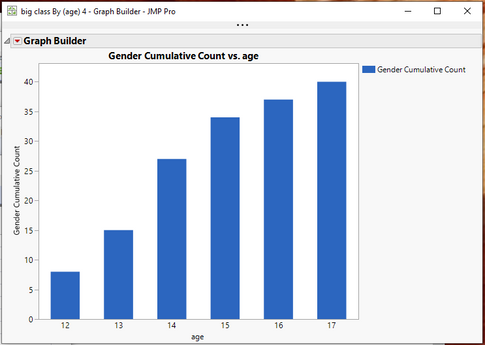
Sorry......to do the counts, just change the statistic to N in the Summary()
names default to here(1);
dt=Open("$SAMPLE_DATA/big class.jmp");

// Summarize the data
dtSum = dt << Summary(
	Group( :age ),
	N( :sex ),
	Freq( "None" ),
	Weight( "None" )
);

// Create the cummulative sum column
dtSum << New Column("Gender Cumulative Count", formula( Col Cumulative Sum( :Name( "N(Sex)" ) )));

// Generate the graph
dtSum << Graph Builder(
	Size( 534, 450 ),
	Show Control Panel( 0 ),
	Variables( X( :age ), Y( :Gender Cumulative Count ) ),
	Elements( Bar( X, Y, Legend( 6 ) ) )
);
Jim
3 REPLIES 3
- Mark as New
- Bookmark
- Subscribe
- Mute
- Subscribe to RSS Feed
- Get Direct Link
- Report Inappropriate Content
Re: Graph Builder commulative counts of events
Others may have an easier way, but this is how I would do it
- Use Tables==>Summary to sum the measurement column(s) for each of the X axis groups.
- Create a new column in the summary table which is the Col Cumulative Sum() of the summarized measurement column(s)
- Graph the data
Very easy to do interactively. But here is the script that produced the above graph
names default to here(1);
dt=Open("$SAMPLE_DATA/big class.jmp");

// Summarize the data
dtSum = dt << Summary(
	Group( :age ),
	Sum( :height ),
	Freq( "None" ),
	Weight( "None" )
);

// Create the cummulative sum column
dtSum << New Column("Height Cumulative Sum", formula( Col Cumulative Sum( :Name( "Sum(height)" ) )));

// Generate the graph
dtSum << Graph Builder(
	Size( 534, 450 ),
	Show Control Panel( 0 ),
	Variables( X( :age ), Y( :Height Cumulative Sum ) ),
	Elements( Bar( X, Y, Legend( 6 ) ) )
);
Jim
- Mark as New
- Bookmark
- Subscribe
- Mute
- Subscribe to RSS Feed
- Get Direct Link
- Report Inappropriate Content
Re: Graph Builder commulative counts of events
Thanks. I knew how to do it with continuous var. I asked about commutative counts, month1 has 2 events, month2 has 5, month3 has 1, so I'll show 2-7-8.
- Mark as New
- Bookmark
- Subscribe
- Mute
- Subscribe to RSS Feed
- Get Direct Link
- Report Inappropriate Content
Re: Graph Builder commulative counts of events
Created:
Jul 20, 2020 05:41 AM
| Last Modified: Jul 20, 2020 3:02 AM
(3136 views)
| Posted in reply to message from RonB 07-20-2020
Sorry......to do the counts, just change the statistic to N in the Summary()
names default to here(1);
dt=Open("$SAMPLE_DATA/big class.jmp");

// Summarize the data
dtSum = dt << Summary(
	Group( :age ),
	N( :sex ),
	Freq( "None" ),
	Weight( "None" )
);

// Create the cummulative sum column
dtSum << New Column("Gender Cumulative Count", formula( Col Cumulative Sum( :Name( "N(Sex)" ) )));

// Generate the graph
dtSum << Graph Builder(
	Size( 534, 450 ),
	Show Control Panel( 0 ),
	Variables( X( :age ), Y( :Gender Cumulative Count ) ),
	Elements( Bar( X, Y, Legend( 6 ) ) )
);
Jim
Recommended Articles
- © 2026 JMP Statistical Discovery LLC. All Rights Reserved.
- Terms of Use
- Privacy Statement
- Contact Us


