Turn on suggestions
Auto-suggest helps you quickly narrow down your search results by suggesting possible matches as you type.
Options
- Subscribe to RSS Feed
- Mark Topic as New
- Mark Topic as Read
- Float this Topic for Current User
- Bookmark
- Subscribe
- Mute
- Printer Friendly Page
Discussions
Solve problems, and share tips and tricks with other JMP users.- JMP User Community
- :
- Discussions
- :
- Graph Builder Overlay Color
- Mark as New
- Bookmark
- Subscribe
- Mute
- Subscribe to RSS Feed
- Get Direct Link
- Report Inappropriate Content
Graph Builder Overlay Color
Created:
Dec 6, 2016 12:03 PM
| Last Modified: Dec 6, 2016 11:33 AM
(13290 views)
Hi,
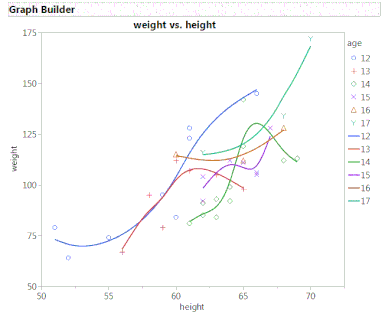
In Graph Builder, how can I use the Overlay and Color options to change the color and marker for each data group? Changing the marker is useful to help distinguish data when there are many colors, which may be very similar to each other.
For example, in the script below, it is useful use Overlay to separate data by age, and use Color to change the color and marker for each point, but if I use them together Overlay will change the line type and color to black, which adds confusion to the graph but no new information.
Names Default To Here( 1 );
dt = Open( "$SAMPLE_DATA/Big Class.jmp" );
dt << Graph Builder(
       Show Control Panel( 0 ),
       Variables( X( :height ), Y( :weight ), Overlay( :age ), Color( :age ) ),
       Elements( Points( X, Y, Legend( 21 ) ), Smoother( X, Y, Legend( 22 ) ) )
);
1 ACCEPTED SOLUTION
Accepted Solutions
- Mark as New
- Bookmark
- Subscribe
- Mute
- Subscribe to RSS Feed
- Get Direct Link
- Report Inappropriate Content
Re: Graph Builder Overlay Color
You can do this by unclicking Color box under Smoother/Variables.
Graph Builder(
	Show Control Panel( 0 ),
	Variables( X( :height ), Y( :weight ), Overlay( :age ), Color( :age ) ),
	Elements(
		Points( X, Y, Legend( 21 ) ),
		Smoother( X, Y, Color( 0 ), Legend( 22 ) )
	)
)
2 REPLIES 2
- Mark as New
- Bookmark
- Subscribe
- Mute
- Subscribe to RSS Feed
- Get Direct Link
- Report Inappropriate Content
Re: Graph Builder Overlay Color
You can do this by unclicking Color box under Smoother/Variables.
Graph Builder(
	Show Control Panel( 0 ),
	Variables( X( :height ), Y( :weight ), Overlay( :age ), Color( :age ) ),
	Elements(
		Points( X, Y, Legend( 21 ) ),
		Smoother( X, Y, Color( 0 ), Legend( 22 ) )
	)
)
- Mark as New
- Bookmark
- Subscribe
- Mute
- Subscribe to RSS Feed
- Get Direct Link
- Report Inappropriate Content
Re: Graph Builder Overlay Color
Thanks!
Recommended Articles
- © 2026 JMP Statistical Discovery LLC. All Rights Reserved.
- Terms of Use
- Privacy Statement
- Contact Us
