- Instantly extract effect sizes, F-ratios, and FDR-adjusted p-values from your models with the Calculate Effects Sizes extension, available now in the JMP Marketplace!
- New to JMP? Join us Sept. 23-24 for the Early User Edition of Discovery Summit, tailor-made for new users. Register now for free!
- Subscribe to RSS Feed
- Mark Topic as New
- Mark Topic as Read
- Float this Topic for Current User
- Bookmark
- Subscribe
- Mute
- Printer Friendly Page
Discussions
Solve problems, and share tips and tricks with other JMP users.- JMP User Community
- :
- Discussions
- :
- Re: Graph Builder, Line of Fit --> Access/display equations

- Mark as New
- Bookmark
- Subscribe
- Mute
- Subscribe to RSS Feed
- Get Direct Link
- Report Inappropriate Content
Graph Builder, Line of Fit --> Access/display equations
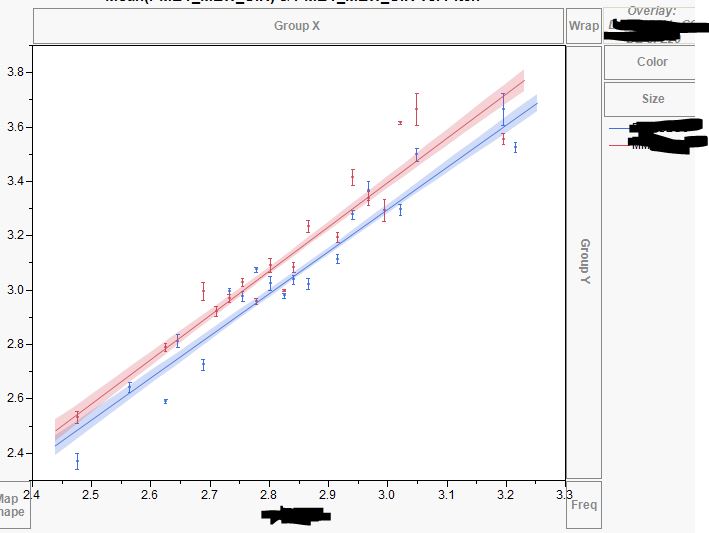
I'm using graph builder to show the trends of a response variable (Y) vs an input (X) for two different groups on the same chart.
To this I add a "Line of Fit" for each group (shown in attached file) and now I want to be able to:
1. display the equations (I can see how to display the RMSE, but not how to display the entire equation).
2. use the fitting parameters in a JSL script to make a column based on the fit parameters. I know how to make the columns and all that once I have the parameters of the fit, but the thing I am not seeing in the documentation is how to access the parameter values for the slope and offset (it is just a linear fit that I'm doing in this instance, but it woudl be nice to know how to do this for a general polynomial fit also).
3. Lastly, if there is a way I can add constraints to the fit (for example constrain slope to unity) that would be helpful in some of the charts I'm going to make in the future.
Thanks,
Charlie
Accepted Solutions

- Mark as New
- Bookmark
- Subscribe
- Mute
- Subscribe to RSS Feed
- Get Direct Link
- Report Inappropriate Content
Re: Graph Builder, Line of Fit --> Access/display equations
For this type of situation, I have always been better served by doing Fit Y by X and adding a best fit to that. You get the equations (and can do more complex fits than just dot to dot or linear), get the values of the line as columns, force intercepts, etc.
Downside is natively you cannot get the 2 graphs to appear on the same axis. HOWEVER, once you have the 2 graphs (do Fit Y by X and then for "By" use the same column that you used in overlay to get 2 separate graphs). you can right click on one of the graphs, Edit, Copy Frame Contents and then right click on the other graph, Edit, Paste Frame Contents and it will drop it there. The 2 are not dynamic, but it is a good way to get an image out if you need to show them on top of each other...

- Mark as New
- Bookmark
- Subscribe
- Mute
- Subscribe to RSS Feed
- Get Direct Link
- Report Inappropriate Content
Re: Graph Builder, Line of Fit --> Access/display equations
In Fit Y by X, if the same functional form is expected for each by group then choose y and x on the initial Fit Y by X dialog but not a by variable. On the secondary dialog from the red triangle pull down choose Group By and specify your by variable. Then when you choose from the various models offered and run the fit, you will get separate fits for each group and the resulting graph will have the fits for each group overlaid and it will be active.
- Mark as New
- Bookmark
- Subscribe
- Mute
- Subscribe to RSS Feed
- Get Direct Link
- Report Inappropriate Content
Re: Graph Builder, Line of Fit --> Access/display equations
Thank you for the replies. Fit Y by X is what I had been using in the past, and I use it still for some of my charts. But I migrated to graph builder for the particular charts in question here because the variable on the x axis is discrete (nominal) while y is continuous and this platform gives me a nice sete of features for that situation - basically I can choose mean as the thing to show for points, and I can add error bars to the plotted means easily. I've had issues in the past running fit Y by X platform without error bars. sometimes the sample sizes are small and the means alone can be misleading and once you put a thing like that out in the wild it takes on a life of its own. I feel having the error bars on there is a feature I must have, while having the equaitons on the chart is "nice to have".
I appreciate the replies and will noodle a bit further on whether fit y by x could get me to where I want to go (basically it is almost there, just no error bars...).
Thanks,
Charlie
Recommended Articles
- © 2026 JMP Statistical Discovery LLC. All Rights Reserved.
- Terms of Use
- Privacy Statement
- Contact Us