- Subscribe to RSS Feed
- Mark Topic as New
- Mark Topic as Read
- Float this Topic for Current User
- Bookmark
- Subscribe
- Mute
- Printer Friendly Page
Discussions
Solve problems, and share tips and tricks with other JMP users.- JMP User Community
- :
- Discussions
- :
- Re: Graph Builder - Help
- Mark as New
- Bookmark
- Subscribe
- Mute
- Subscribe to RSS Feed
- Get Direct Link
- Report Inappropriate Content
Graph Builder - Help
Dear Community,
some time ago... I created a "simple" but very interesting (for me) graph with Graph Builder.
After some weeks... I do not rememebr the steps I followed to create it.
Some of you is able to help be see step by step the generation of this graph (see the details on the left Y axis, the different colors, split by variables, legenda,...)?
In attachment you can find the data and the output I would like to have.
Thanks in advance for your help and feedback.
Best Regards,
Simone
Accepted Solutions
- Mark as New
- Bookmark
- Subscribe
- Mute
- Subscribe to RSS Feed
- Get Direct Link
- Report Inappropriate Content
Re: Graph Builder - Help
I am not able to get the graph closer than I displayed in my last response. If you had saved the script from you last run, you would have been able to easily regenerate the graph.
- Mark as New
- Bookmark
- Subscribe
- Mute
- Subscribe to RSS Feed
- Get Direct Link
- Report Inappropriate Content
Re: Graph Builder - Help
Open Graph Builder. Drag VALUE to the X drop zone. Drag VARIABLE to the Group Y drop zone. Drag Variable to the Color button. Select the distribution icon from the row of icons (7th icon). You can label the bars using the Label by Variable option. You can change the Y axis scale by right clicking on the Y axis and selecting Axis Settings.
- Mark as New
- Bookmark
- Subscribe
- Mute
- Subscribe to RSS Feed
- Get Direct Link
- Report Inappropriate Content
Re: Graph Builder - Help
Dear Statman,
thanks for the replay.
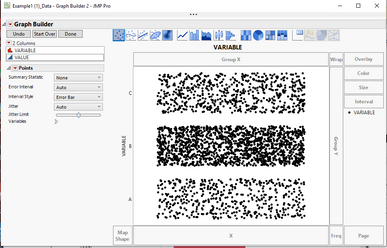
I followed you suggestions... but the risult is not as expectation.
I do not konw if I followed your suggestion in the correct way.
In attachment the steps and the output.
Some suggestion from your side?
Thanks in advance.
Best Regards,
Simone
- Mark as New
- Bookmark
- Subscribe
- Mute
- Subscribe to RSS Feed
- Get Direct Link
- Report Inappropriate Content
Re: Graph Builder - Help
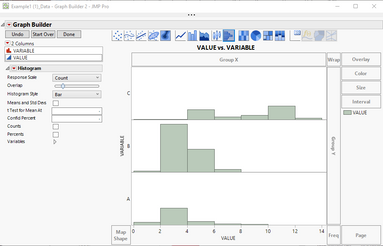
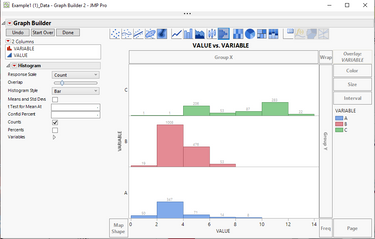
Here are the instructions that I used to get what you want
1. Drag column Variable to the Y drop area.....not the Y Group Drop area
2. Drag the Value column to the X drop area
3. Click on the Histogram Icon
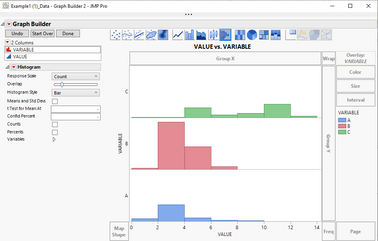
4. Drag the Variable column to the Overlay drop area
5. Click on the Counts Checkbox to label the bars
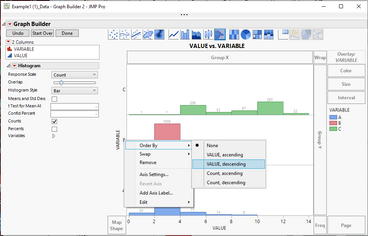
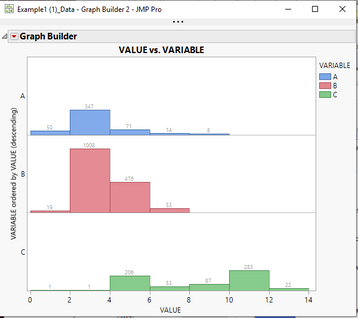
6. Right click on the Y axis and select Order By==>VALUE, descending to change the order of the Y axis
7. Click on the Done button
I believe this meets your desired output
The Graph Builder Platform is Fully Documented. I suggest that you read it! It is located as a chapter in the document, Essential Graphing
Help==>JMP Documentation Library==>Essential Graphics
- Mark as New
- Bookmark
- Subscribe
- Mute
- Subscribe to RSS Feed
- Get Direct Link
- Report Inappropriate Content
Re: Graph Builder - Help
Dear Jim,
first of all thanks for your detailed feedback (appreciated).
But... ... I have still 2 question
QUESTION 1
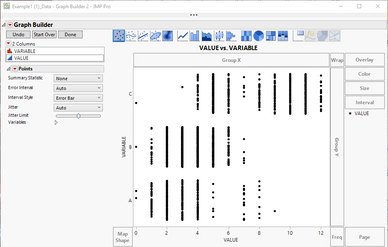
I followed your steps... but in one step the output is different (see below).
Do you know why?
Could it depends from the JMP version (I have JMP 14.0)?
QUESTION 2
I see your final graph... it is not "real" equal to the graph I created some weeks ago.
The main difference is in the Y axis (see below).
Do you have some comments on this?
This situation "making me crazy"... some weeks ago I created this graph with same JMP version and data...
and now... I'm not able to do it again...
Thanks in advance for your feedback.
Best regards,
Simone
- Mark as New
- Bookmark
- Subscribe
- Mute
- Subscribe to RSS Feed
- Get Direct Link
- Report Inappropriate Content
Re: Graph Builder - Help
I am not able to get the graph closer than I displayed in my last response. If you had saved the script from you last run, you would have been able to easily regenerate the graph.
Recommended Articles
- © 2026 JMP Statistical Discovery LLC. All Rights Reserved.
- Terms of Use
- Privacy Statement
- Contact Us


