Turn on suggestions
Auto-suggest helps you quickly narrow down your search results by suggesting possible matches as you type.
- Don’t miss your chance to experience Discovery Summit Europe at our best available rate! Early bird registration through 31 Oct.
- Graph Builder Toolbar streamlines interactive graphing. Creates shortcuts on Report and GraphBuilder Helpers toolbars. Download and install the extension.
- JMP will suspend normal business operations for our Rest and Recharge Day on Friday, October 2, 2026.
Regular business hours will resume on Monday, October 5, 2026.
Options
- Subscribe to RSS Feed
- Mark Topic as New
- Mark Topic as Read
- Float this Topic for Current User
- Bookmark
- Subscribe
- Mute
- Printer Friendly Page
Discussions
Solve problems, and share tips and tricks with other JMP users.- User Community
- :
- Discussions
- :
- Re: Graph Builder Heatmap gridlines

Level VII
- Mark as New
- Bookmark
- Subscribe
- Mute
- Subscribe to RSS Feed
- Get Direct Link
- Report Inappropriate Content
Graph Builder Heatmap gridlines
Jul 17, 2023 11:43 PM
(2887 views)
Why are gridlines weird in heatmaps? It seems like categorical data should draw the gridlines between the categories, not on top of the category:
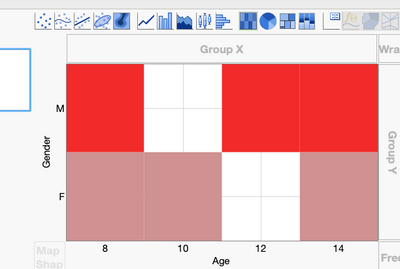
Is there a way to make it automatically draw the gridlines between the categories?
2 REPLIES 2


Super User
- Mark as New
- Bookmark
- Subscribe
- Mute
- Subscribe to RSS Feed
- Get Direct Link
- Report Inappropriate Content
Re: Graph Builder Heatmap gridlines
Hi,
You can change the gridline appearance by changing the tickmark format in the axis setting.
- Right-click on the axis of your choice
- Select Axis Settings
- Next to "Show Tick Label", choose "Long Mark" or "Interval Tray"
- Repeat on the other axis as required
Best,
TS
Thierry R. Sornasse
Level VII
- Mark as New
- Bookmark
- Subscribe
- Mute
- Subscribe to RSS Feed
- Get Direct Link
- Report Inappropriate Content
Re: Graph Builder Heatmap gridlines
I think you mean "Long Divider", but yes, that works. Seems like that should be the setting that gets chosen for "Automatic" when using heatmaps on categorical data. I'll submit a wish list item.
Thanks!
Recommended Articles
- © 2026 JMP Statistical Discovery LLC. All Rights Reserved.
- Terms of Use
- Privacy Statement
- Contact Us