- New to JMP? Join us Sept. 23-24 for the Early User Edition of Discovery Summit, tailor-made for new users. Register now for free!
- Your voice matters! Tell us how you prefer to receive JMP updates, so we can tailor our communication to your needs. Take short survey.
- See how to access JMP Marketplace - and - find, create & share add-ins to extend your JMP. Watch video.
- Subscribe to RSS Feed
- Mark Topic as New
- Mark Topic as Read
- Float this Topic for Current User
- Bookmark
- Subscribe
- Mute
- Printer Friendly Page
Discussions
Solve problems, and share tips and tricks with other JMP users.- JMP User Community
- :
- Discussions
- :
- Re: Graph Builder Confidence Interval

- Mark as New
- Bookmark
- Subscribe
- Mute
- Subscribe to RSS Feed
- Get Direct Link
- Report Inappropriate Content
Graph Builder Confidence Interval
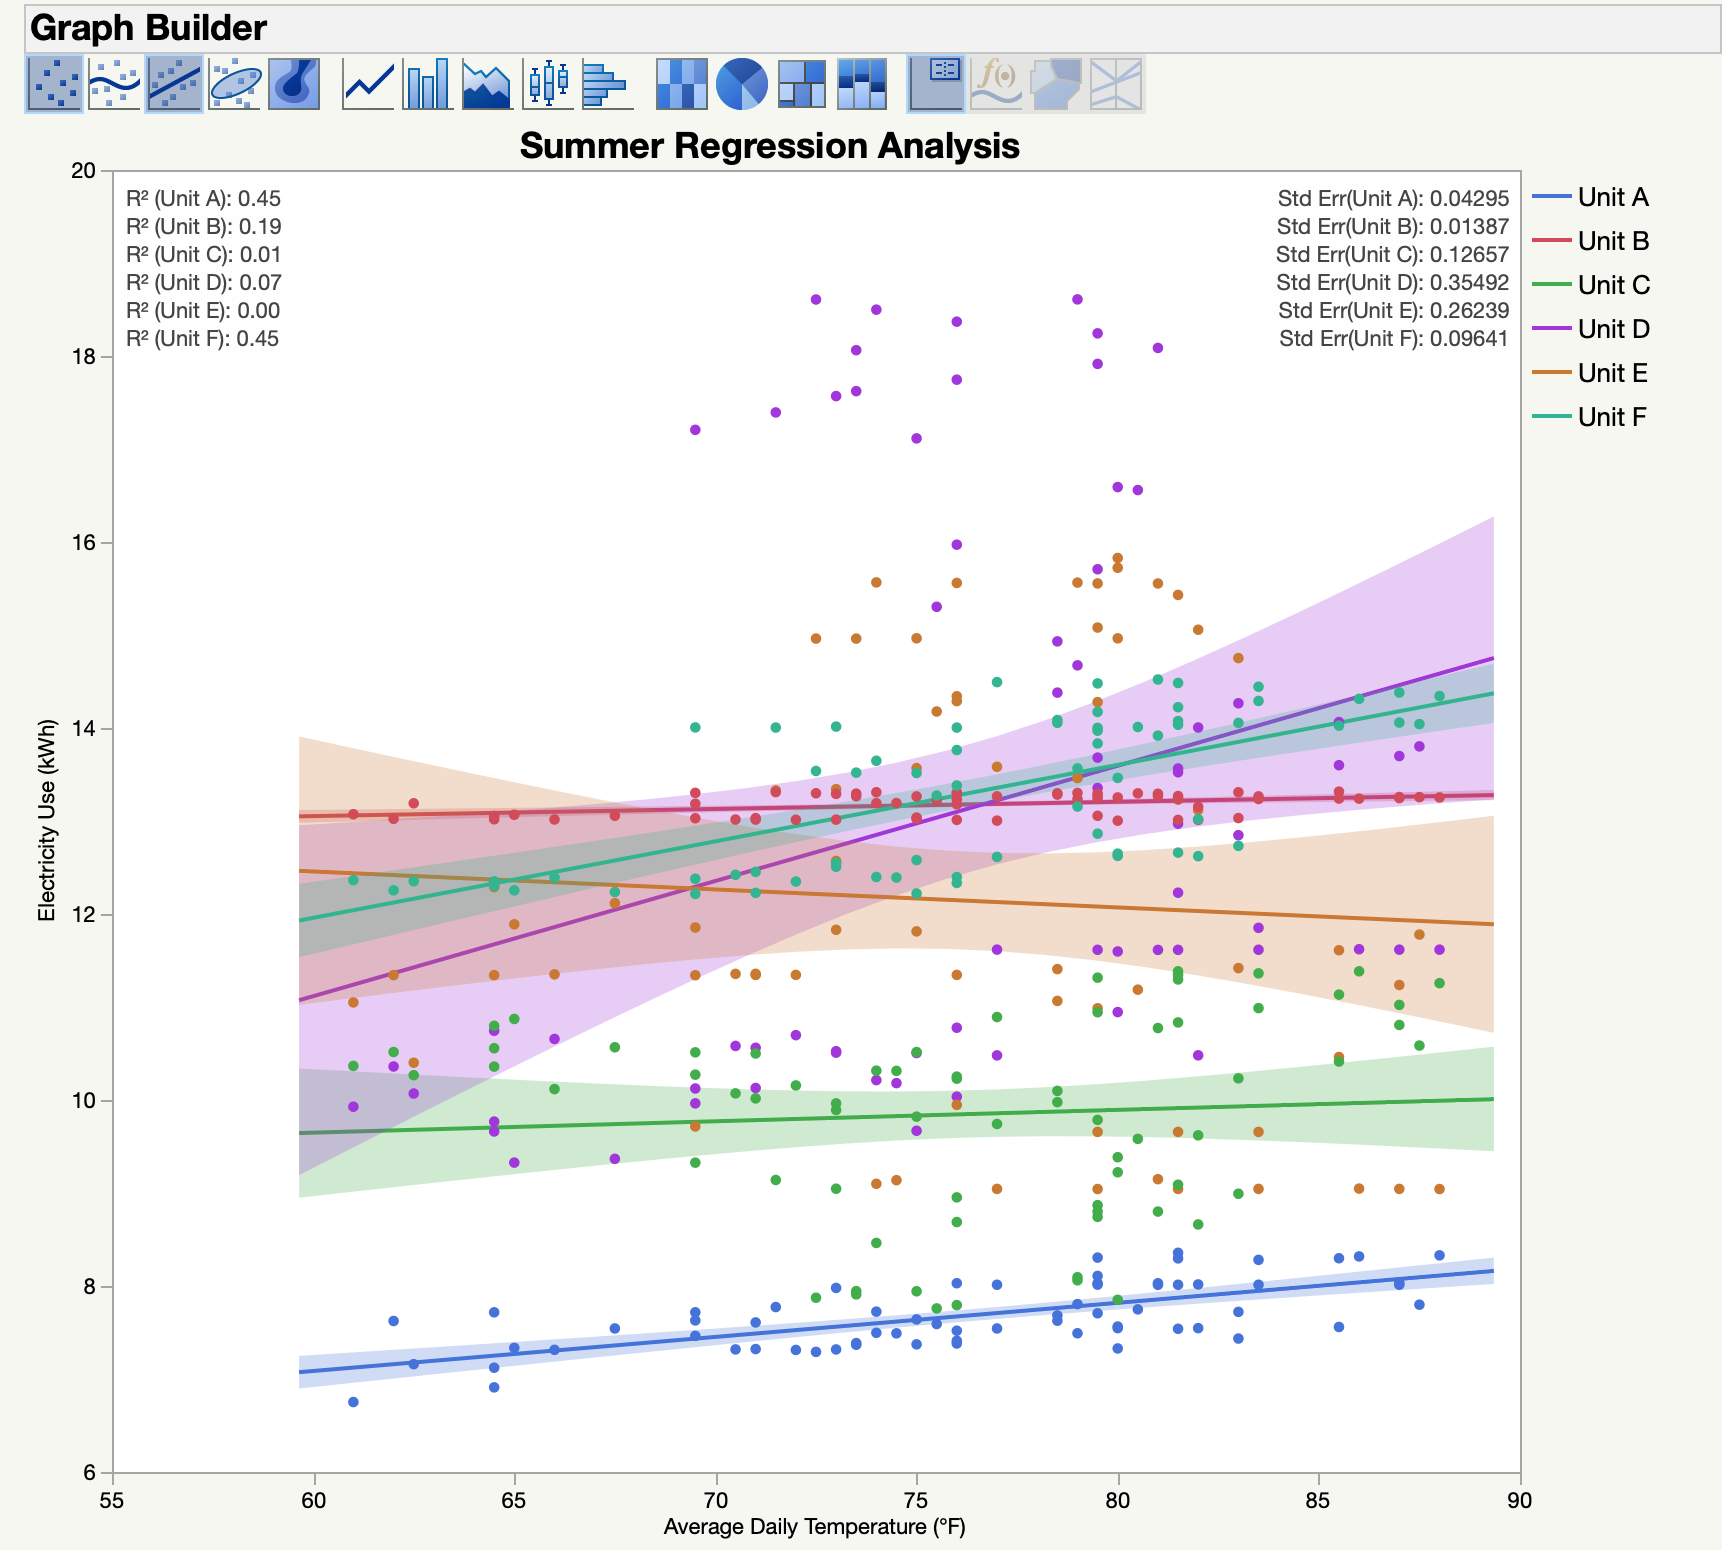
I have made several plots using JMP's graph builder with a regression fitted line and the confidence interval gets wider and thinner (see attached below). Doesn't JMP use a confidence interval of 95%? Much appreciation for your helping this novice JMP user and budding statistics learner
Accepted Solutions

- Mark as New
- Bookmark
- Subscribe
- Mute
- Subscribe to RSS Feed
- Get Direct Link
- Report Inappropriate Content
Re: Graph Builder Confidence Interval
The confidence interval for the mean response is a 'quadratic form.' It depends on the constant response variance, the design matrix (data), the linear model, and the predictor level.
See this article.

- Mark as New
- Bookmark
- Subscribe
- Mute
- Subscribe to RSS Feed
- Get Direct Link
- Report Inappropriate Content
Re: Graph Builder Confidence Interval
Piggybacking off @Mark_Bailey's response here. Yes, the Confidence Interval of the prediction for a continuous Y vs a continuous X in Graph Builder uses a 95% level by default, and the interval width is smaller at the mean of the regression (the midpoint of the fitted line) than at the ends of the regression line. This confidence interval on the regression line is sometimes referred to as a "hotelling" confidence band, and you can have JMP compute and save these calculated confidence limits boundaries for you in Graph Builder (or in the Bivariate Platform, where they should be exactly the same). As mentioned, the formulas use a 'quadratic form' and this is reflected in the vector quadratic function saved out in column formulas to the JMP data table for these limits.
For a continuous Y on a nominal (or ordinal) X in Graph Builder, I'd like to point out that JMP also uses a 95% level by default. Here, if using the Points, summarizing on the Mean (Summary Statistic), and picking Confidence Interval (Error Interval), then JMP performs a classical "t-statistic based" interval estimation calculation where the CI for each level is calculated independently. The formula is given in most introductory statistical textbooks, and it looks like this:

(image courtesy of JMP STIPS Decision Making With Data Course Module Constructing Confidence Intervals)
where t is the t-statistic at: 1 minus α Confidence level and at n minus 1 degrees of freedom (where n is sample size),
S is the standard deviation, and X-bar is the mean.
For more information, see the Decision Making with Data Module of JMP's free online statistics course, STIPS (at jmp.com/statisticalthinking).
- Mark as New
- Bookmark
- Subscribe
- Mute
- Subscribe to RSS Feed
- Get Direct Link
- Report Inappropriate Content
Re: Graph Builder Confidence Interval
Yes, JMP computes and displays 95% confidence intervals of the mean function in the Graph Builder plot you showed.
- Mark as New
- Bookmark
- Subscribe
- Mute
- Subscribe to RSS Feed
- Get Direct Link
- Report Inappropriate Content
Re: Graph Builder Confidence Interval
- Mark as New
- Bookmark
- Subscribe
- Mute
- Subscribe to RSS Feed
- Get Direct Link
- Report Inappropriate Content
Re: Graph Builder Confidence Interval
The confidence interval for the mean response is a 'quadratic form.' It depends on the constant response variance, the design matrix (data), the linear model, and the predictor level.
See this article.
- Mark as New
- Bookmark
- Subscribe
- Mute
- Subscribe to RSS Feed
- Get Direct Link
- Report Inappropriate Content
Re: Graph Builder Confidence Interval
I interpret your surprise at the change in the width of the confidence interval for the mean response to indicate that you have not studied linear regression, so I will not use a mathematical explanation.
Imagine that you have just two observations for X and Y. You fit a line between them. Where is the support for this model? You might think that it is at one or the other observation because that is the physical evidence. It is actually the strongest at the mid-point of the line, even though there are no observations at that point. The reason is that the mid-point of the model is supported equally and maximally by the points to either side. So the confidence interval at the mid-point is shorter than it is at the ends of the line where you observed the response.
Note that the interval length is always strictly in the vertical direction. It is not normal to the fitted line.
- Mark as New
- Bookmark
- Subscribe
- Mute
- Subscribe to RSS Feed
- Get Direct Link
- Report Inappropriate Content
Re: Graph Builder Confidence Interval
Piggybacking off @Mark_Bailey's response here. Yes, the Confidence Interval of the prediction for a continuous Y vs a continuous X in Graph Builder uses a 95% level by default, and the interval width is smaller at the mean of the regression (the midpoint of the fitted line) than at the ends of the regression line. This confidence interval on the regression line is sometimes referred to as a "hotelling" confidence band, and you can have JMP compute and save these calculated confidence limits boundaries for you in Graph Builder (or in the Bivariate Platform, where they should be exactly the same). As mentioned, the formulas use a 'quadratic form' and this is reflected in the vector quadratic function saved out in column formulas to the JMP data table for these limits.
For a continuous Y on a nominal (or ordinal) X in Graph Builder, I'd like to point out that JMP also uses a 95% level by default. Here, if using the Points, summarizing on the Mean (Summary Statistic), and picking Confidence Interval (Error Interval), then JMP performs a classical "t-statistic based" interval estimation calculation where the CI for each level is calculated independently. The formula is given in most introductory statistical textbooks, and it looks like this:
(image courtesy of JMP STIPS Decision Making With Data Course Module Constructing Confidence Intervals)
where t is the t-statistic at: 1 minus α Confidence level and at n minus 1 degrees of freedom (where n is sample size),
S is the standard deviation, and X-bar is the mean.
For more information, see the Decision Making with Data Module of JMP's free online statistics course, STIPS (at jmp.com/statisticalthinking).
Recommended Articles
- © 2026 JMP Statistical Discovery LLC. All Rights Reserved.
- Terms of Use
- Privacy Statement
- Contact Us