- Don’t miss your chance to experience Discovery Summit Europe at our best available rate! Early bird registration through 31 Oct.
- Graph Builder Toolbar streamlines interactive graphing. Creates shortcuts on Report and GraphBuilder Helpers toolbars. Download and install the extension.
- Subscribe to RSS Feed
- Mark Topic as New
- Mark Topic as Read
- Float this Topic for Current User
- Bookmark
- Subscribe
- Mute
- Printer Friendly Page
Discussions
Solve problems, and share tips and tricks with other JMP users.- User Community
- :
- Discussions
- :
- Re: Graph Builder Box Plot Color

- Mark as New
- Bookmark
- Subscribe
- Mute
- Subscribe to RSS Feed
- Get Direct Link
- Report Inappropriate Content
Graph Builder Box Plot Color
On the Graph Builder Box Plot, it is possible to color each box using the "Overlay" feature, but this makes the graph slightly less readable by reducing the box width, which is unnecessary in some contexts. Can JMP add a "Color" feature to the Graph Builder Box Plot?
I am using JMP 14.3.0.
Related: Fit Y by X, is it possible to color the boxes in a Box Plot by a column? What about Graph Builder?
Names Default To Here( 1 );
dt = Open( "$SAMPLE_DATA/Big Class.jmp" );
dt << New Column( "age 2", Numeric, "Ordinal", Format( "Best", 12 ), Formula( :age ) );
dt << New Column( "null", Numeric, "Ordinal", Format( "Best", 12 ), Formula( 0 ) );

dt << Graph Builder(
	Show Control Panel( 0 ),
	Variables( X( :age ), Y( :height ), Overlay( :null ) ),
	Elements( Box Plot( X, Y, Legend( 6 ), Box Style( "Solid" ) ) ),
	Column Switcher( :null, {:age 2, :null} )
);Accepted Solutions


- Mark as New
- Bookmark
- Subscribe
- Mute
- Subscribe to RSS Feed
- Get Direct Link
- Report Inappropriate Content
Re: Graph Builder Box Plot Color
You can interactively change the color of the box plots, by right clicking on the chart and selecting "Customize"
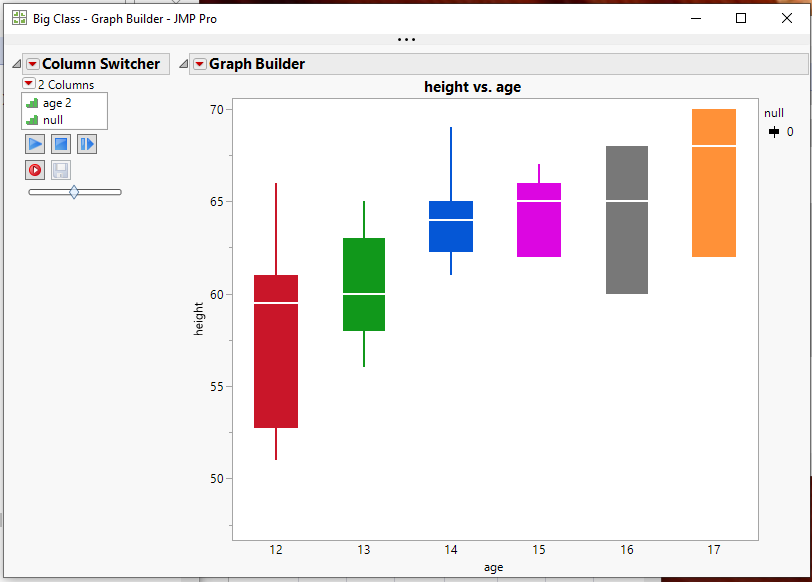
Programmatically the script below was what the graph builder generated after I changed the color of the boxes
Graph Builder(
	Show Control Panel( 0 ),
	Variables( X( :age ), Y( :height ), Overlay( :null ) ),
	Elements( Box Plot( X, Y, Legend( 6 ), Box Style( "Solid" ) ) ),
	Column Switcher( :null, {:age 2, :null} ),
	SendToReport(
		Dispatch(
			{},
			"Graph Builder",
			FrameBox,
			{DispatchSeg(
				Box Plot Seg( "Box Plot (12)" ),
				{Line Color( "Medium Dark Red" ), Fill Color( "Medium Dark Red" ),
				Fill( 0 )}
			), DispatchSeg(
				Box Plot Seg( "Box Plot (13)" ),
				{Line Color( "Medium Dark Green" ),
				Fill Color( "Medium Dark Green" ), Fill( 0 )}
			), DispatchSeg(
				Box Plot Seg( "Box Plot (14)" ),
				{Line Color( "Medium Dark Blue" ), Fill Color( "Medium Dark Blue" ),
				Fill( 0 )}
			), DispatchSeg(
				Box Plot Seg( "Box Plot (15)" ),
				{Line Color( "Magenta" ), Fill Color( "Magenta" ), Fill( 0 )}
			), DispatchSeg(
				Box Plot Seg( "Box Plot (16)" ),
				{Line Color( "Gray" ), Fill Color( "Gray" ), Fill( 0 )}
			), DispatchSeg(
				Box Plot Seg( "Box Plot (17)" ),
				{Line Color( "Medium Light Orange" ),
				Fill Color( "Medium Light Orange" ), Fill( 0 )}
			)}
		)
	)
);

- Mark as New
- Bookmark
- Subscribe
- Mute
- Subscribe to RSS Feed
- Get Direct Link
- Report Inappropriate Content
Re: Graph Builder Box Plot Color
Sorry @robot , I didn't read your post carefully, and did not test on 14.3. I am using JMP15.
- Mark as New
- Bookmark
- Subscribe
- Mute
- Subscribe to RSS Feed
- Get Direct Link
- Report Inappropriate Content
Re: Graph Builder Box Plot Color
You can interactively change the color of the box plots, by right clicking on the chart and selecting "Customize"
Programmatically the script below was what the graph builder generated after I changed the color of the boxes
Graph Builder(
	Show Control Panel( 0 ),
	Variables( X( :age ), Y( :height ), Overlay( :null ) ),
	Elements( Box Plot( X, Y, Legend( 6 ), Box Style( "Solid" ) ) ),
	Column Switcher( :null, {:age 2, :null} ),
	SendToReport(
		Dispatch(
			{},
			"Graph Builder",
			FrameBox,
			{DispatchSeg(
				Box Plot Seg( "Box Plot (12)" ),
				{Line Color( "Medium Dark Red" ), Fill Color( "Medium Dark Red" ),
				Fill( 0 )}
			), DispatchSeg(
				Box Plot Seg( "Box Plot (13)" ),
				{Line Color( "Medium Dark Green" ),
				Fill Color( "Medium Dark Green" ), Fill( 0 )}
			), DispatchSeg(
				Box Plot Seg( "Box Plot (14)" ),
				{Line Color( "Medium Dark Blue" ), Fill Color( "Medium Dark Blue" ),
				Fill( 0 )}
			), DispatchSeg(
				Box Plot Seg( "Box Plot (15)" ),
				{Line Color( "Magenta" ), Fill Color( "Magenta" ), Fill( 0 )}
			), DispatchSeg(
				Box Plot Seg( "Box Plot (16)" ),
				{Line Color( "Gray" ), Fill Color( "Gray" ), Fill( 0 )}
			), DispatchSeg(
				Box Plot Seg( "Box Plot (17)" ),
				{Line Color( "Medium Light Orange" ),
				Fill Color( "Medium Light Orange" ), Fill( 0 )}
			)}
		)
	)
);- Mark as New
- Bookmark
- Subscribe
- Mute
- Subscribe to RSS Feed
- Get Direct Link
- Report Inappropriate Content
Re: Graph Builder Box Plot Color
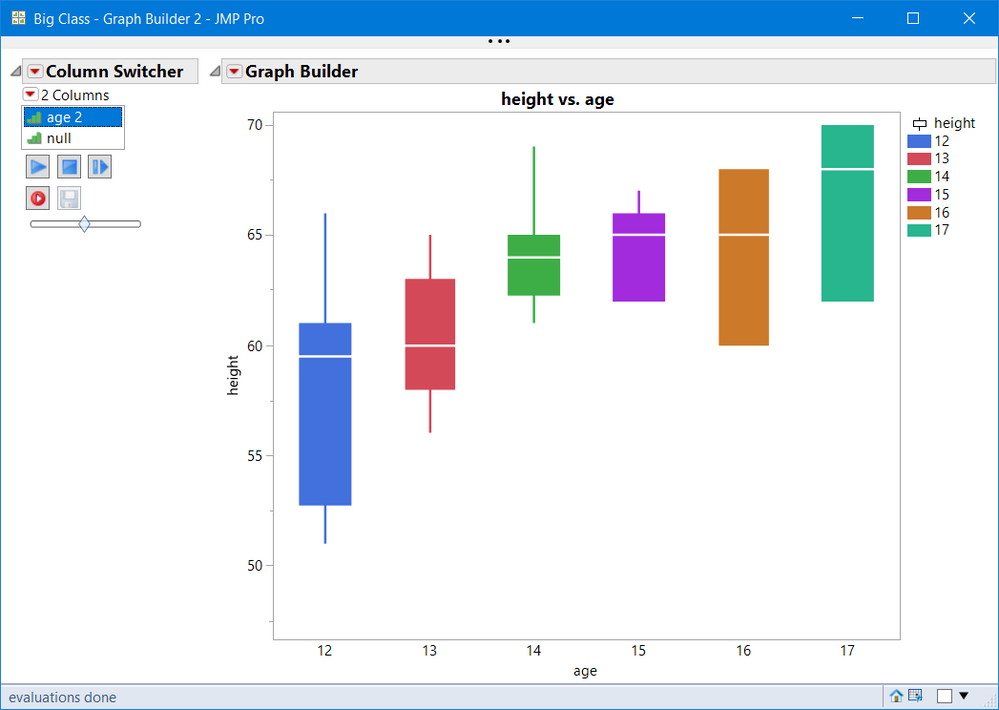
Instead of giving :null the Overlay role, make it the Color role
Names Default To Here( 1 );
dt = Open( "$SAMPLE_DATA/Big Class.jmp" );
dt << New Column( "age 2", Numeric, "Ordinal", Format( "Best", 12 ), Formula( :age ) );
dt << New Column( "null", Numeric, "Ordinal", Format( "Best", 12 ), Formula( 0 ) );

dt << Graph Builder(
	Show Control Panel( 0 ),
	Variables( X( :age ), Y( :height ), Color( :null ) ),
	Elements( Box Plot( X, Y, Legend( 6 ), Box Style( "Solid" ) ) ),
	Column Switcher( :null, {:age 2, :null} )
);
- Mark as New
- Bookmark
- Subscribe
- Mute
- Subscribe to RSS Feed
- Get Direct Link
- Report Inappropriate Content
Re: Graph Builder Box Plot Color
Thanks @gzmorgan0. What version of JMP are you using? In JMP 14.3.0, the "Color" role has no effect.
- Mark as New
- Bookmark
- Subscribe
- Mute
- Subscribe to RSS Feed
- Get Direct Link
- Report Inappropriate Content
Re: Graph Builder Box Plot Color
Sorry @robot , I didn't read your post carefully, and did not test on 14.3. I am using JMP15.
- Mark as New
- Bookmark
- Subscribe
- Mute
- Subscribe to RSS Feed
- Get Direct Link
- Report Inappropriate Content
Re: Graph Builder Box Plot Color

- Mark as New
- Bookmark
- Subscribe
- Mute
- Subscribe to RSS Feed
- Get Direct Link
- Report Inappropriate Content
Re: Graph Builder Box Plot Color
It is not working in v13.2 either.
Loughlin Consulting
- Mark as New
- Bookmark
- Subscribe
- Mute
- Subscribe to RSS Feed
- Get Direct Link
- Report Inappropriate Content
Re: Graph Builder Box Plot Color
That works on v13.2. Thanx.
Loughlin Consulting
- Mark as New
- Bookmark
- Subscribe
- Mute
- Subscribe to RSS Feed
- Get Direct Link
- Report Inappropriate Content
Re: Graph Builder Box Plot Color
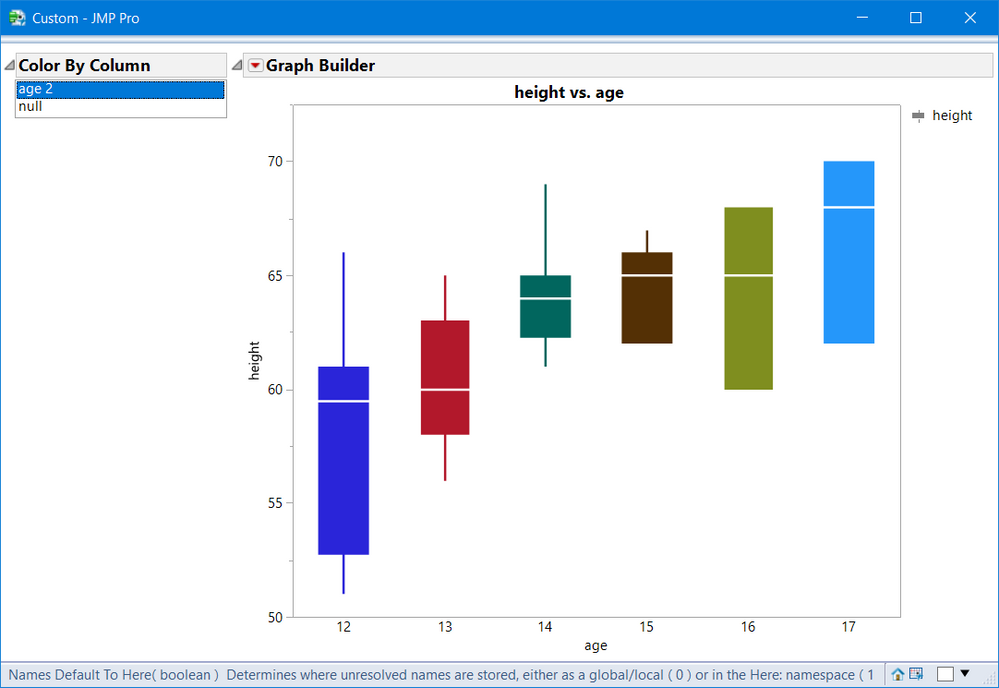
Just in case you wanted something like column switcher, here is a script that works in JMP 14.3 and 13.2
Names Default To Here( 1 );
dt = Open( "$SAMPLE_DATA/Big Class.jmp" );
dt << New Column( "age 2", Numeric, "Ordinal", Format( "Best", 12 ), Formula( :age ) );
dt << New Column( "null", Numeric, "Ordinal", Format( "Best", 12 ), Formula( 0 ) );

dt << Color by Column( :age2 );

dtsum = dt << Summary( Group( :age2) );
dtsum << New Column( "Color", Numeric, << set each value (Color Of() ) );

a_color = dtsum:Color << get values;
a_age   = dtsum:age2 << get values;
naa = nitems(a_age);

Close( dtsum, NoSave);

New Window("Custom",
HListBox(
    ob1 = OutlineBox( "Color By Column",
        lb = ListBox({"age 2", "null"}, maxselected(1), nlines(2), <<Script(colorby_xp) )
    ),
	g = dt << Graph Builder(
		Show Control Panel( 0 ),
		Variables( X( :age ), Y( :height ) ),
		Elements( Box Plot( X, Y, Legend( 6 ), Box Style( "Solid" ) ) )
	)
)
);

//selcol = ob1[ListBoxBox(1)];
wait(0);

bpseg = g << Xpath("//BoxPlotSeg");
//check
if(nitems(bpseg) != naa, Throw("Item mismatch loock for all missing category") );

colorby_xp = Expr(
   cc = (lb << get selected)[1];
   Print(cc);
   If( cc =="age 2",
        for(i=1, i<=naa, i++, bpseg[i] << Fill Color( a_color[i] ) ),
       cc == "null",
        bpseg << Fill Color(" Medium Dark Gray")
   )
 );
- Mark as New
- Bookmark
- Subscribe
- Mute
- Subscribe to RSS Feed
- Get Direct Link
- Report Inappropriate Content
Re: Graph Builder Box Plot Color
Recommended Articles
- © 2026 JMP Statistical Discovery LLC. All Rights Reserved.
- Terms of Use
- Privacy Statement
- Contact Us