- JMP will suspend normal business operations for our Winter Holiday beginning on Wednesday, Dec. 24, 2025, at 5:00 p.m. ET (2:00 p.m. ET for JMP Accounts Receivable).
Regular business hours will resume at 9:00 a.m. EST on Friday, Jan. 2, 2026. - We’re retiring the File Exchange at the end of this year. The JMP Marketplace is now your destination for add-ins and extensions.
- Subscribe to RSS Feed
- Mark Topic as New
- Mark Topic as Read
- Float this Topic for Current User
- Bookmark
- Subscribe
- Mute
- Printer Friendly Page
Discussions
Solve problems, and share tips and tricks with other JMP users.- JMP User Community
- :
- Discussions
- :
- Graph Builder Bar Charts

- Mark as New
- Bookmark
- Subscribe
- Mute
- Subscribe to RSS Feed
- Get Direct Link
- Report Inappropriate Content
Graph Builder Bar Charts
Hello everybody,
I would like to visualize data in a bar chart. I´ve got defined values for the start point and the range (length) of every bar. See files attached.
Is it possible to visualize data like that?
Thanks in advance.
Johannes
Accepted Solutions

- Mark as New
- Bookmark
- Subscribe
- Mute
- Subscribe to RSS Feed
- Get Direct Link
- Report Inappropriate Content
Re: Graph Builder Bar Charts
Hi @JohannesENS
please find attached and run the script in the table.
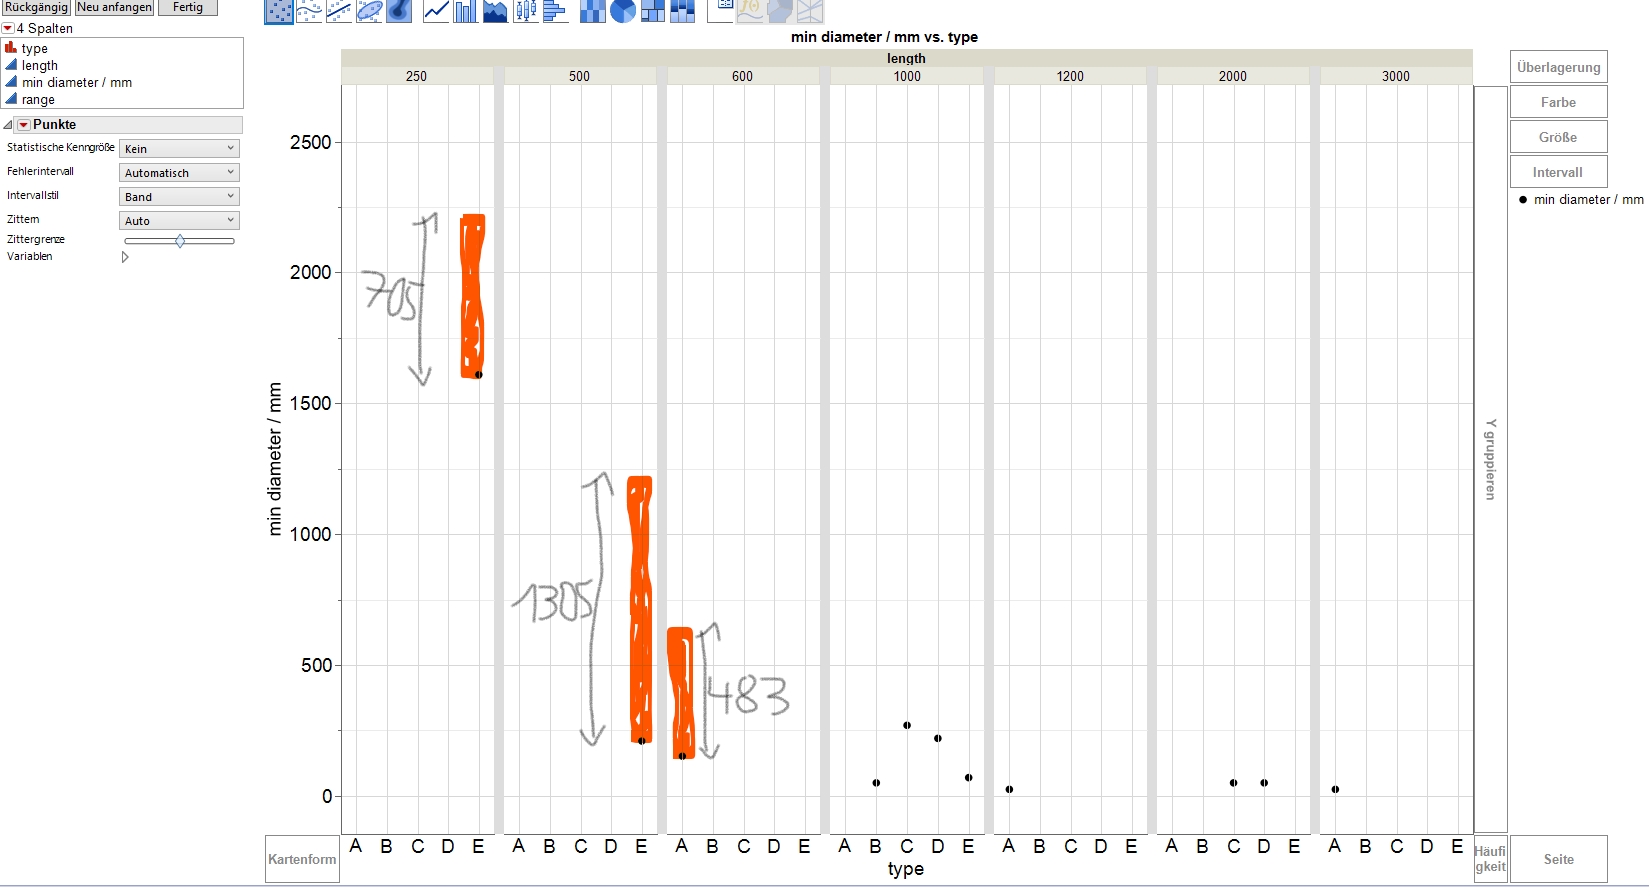
one way of doing this is by introducing a new column with the formula :"min diameter / mm"n + :range

now you set the min diameter and the max diameter together on the Y axis. then you choose bars and select the range option

let us know if it worked,
ron
- Mark as New
- Bookmark
- Subscribe
- Mute
- Subscribe to RSS Feed
- Get Direct Link
- Report Inappropriate Content
Re: Graph Builder Bar Charts
Hi @JohannesENS
please find attached and run the script in the table.
one way of doing this is by introducing a new column with the formula :"min diameter / mm"n + :range
now you set the min diameter and the max diameter together on the Y axis. then you choose bars and select the range option
let us know if it worked,
ron
- Mark as New
- Bookmark
- Subscribe
- Mute
- Subscribe to RSS Feed
- Get Direct Link
- Report Inappropriate Content
Re: Graph Builder Bar Charts
Thank you!
Recommended Articles
- © 2025 JMP Statistical Discovery LLC. All Rights Reserved.
- Terms of Use
- Privacy Statement
- Contact Us