- Don’t miss your chance to experience Discovery Summit Europe at our best available rate! Early bird registration through 31 Oct.
- Graph Builder Toolbar streamlines interactive graphing. Creates shortcuts on Report and GraphBuilder Helpers toolbars. Download and install the extension.
- Subscribe to RSS Feed
- Mark Topic as New
- Mark Topic as Read
- Float this Topic for Current User
- Bookmark
- Subscribe
- Mute
- Printer Friendly Page
Discussions
Solve problems, and share tips and tricks with other JMP users.- User Community
- :
- Discussions
- :
- Re: Gauge R&R Report into a data table

- Mark as New
- Bookmark
- Subscribe
- Mute
- Subscribe to RSS Feed
- Get Direct Link
- Report Inappropriate Content
Gauge R&R Report into a data table
I need to create Gauge R&R studies for many systems, how to i export the results of the Gauge R&R report into a data table.
Can a create a script to extract the Repeatability, Reproducibility ... data into a table?
Accepted Solutions


- Mark as New
- Bookmark
- Subscribe
- Mute
- Subscribe to RSS Feed
- Get Direct Link
- Report Inappropriate Content
Re: Gauge R&R Report into a data table
Here is an example of what I think is pretty close to what you want
Names Default To Here( 1 );
dt = Open( "$SAMPLE_DATA/Variability Data/wafer.jmp" );
// Add some new columns to allow for the sample data
// table to look somewhat like your table
For( i = 2, i <= 5, i++,
	dt << New Column( "Y" || Char( i ), formula( Random Uniform( 80, 120 ) ) )
);

colList = dt << get column names( string, continuous );

// Create a starter data table for placing all of the results in
dtFinal = New Table( "Final Results Table" );

// Loop across all of the columns and extract the required data
For( i = 1, i <= N Items( colList ), i++,
	vc = dt << Variability Chart(
		invisible,
		Y( Eval( colList[i] ) ),
		X( :Operator, :Wafer ),
		Model( "Main Effect" ),
		Historical Sigma( 0 ),
		Name( "Gauge R&R" )(6, 0, 0, 0),
		Name( "Gauge R&R Report" )(1)
	);

	// Point at the report table you are interested in, and
	// pass the message to it to create the data table from it
	dtRR = Report( vc )["Gauge R&R"][Table Box( 1 )] << Make combined Data Table;

	dtFinal = dtFinal << concatenate( dtRR, append to first table( 1 ) );

	Close( dtRR, nosave );
);

// Make the transposed data table
dtReport = dtFinal << Split(
	Split By( :Measurement Source ),
	Split(
		:Name( "~AIAG abbrev" ),
		:Name( "Variation (6*StdDev)" ),
		:Name( "~AIAG Label" ),
		:Name( "which is 6*sqrt of" )
	),
	Group( :Y ),
	Sort by Column Property,
	Output Table("Guage R&R Report")
);
Also, the Scripting Guide is not a real good examples book, from the stand point of, "Here is how you do X". It is a document targeted to teach the language. So I suggest that you spend a bit more time with it and you will learn how to use it's components to generate your scripts.
- Mark as New
- Bookmark
- Subscribe
- Mute
- Subscribe to RSS Feed
- Get Direct Link
- Report Inappropriate Content
Re: Gauge R&R Report into a data table
Here is an example of extracting the data table you requested.
Names default to here(1);
dt=open("$SAMPLE_DATA/Variability Data/wafer.jmp");
vc = dt << Variability Chart(
	Y( :Y ),
	X( :Operator, :Wafer ),
	Model( "Main Effect" ),
	Historical Sigma( 0 ),
	Name( "Gauge R&R" )(6, 0, 0, 0),
	Name( "Gauge R&R Report" )(1)
);

// Point at the report table you are interested in, and
// pass the message to it to create the data table from it
dtRR = report(vc)["Gauge R&R"][TableBox(1)] << Make into Data Table;
Documentation on working with the output Display Trees is in the Scripting Guide.
- Mark as New
- Bookmark
- Subscribe
- Mute
- Subscribe to RSS Feed
- Get Direct Link
- Report Inappropriate Content
Re: Gauge R&R Report into a data table
Thank you for the prompt response,
Im trying to create a script to go through all columns in table 1 to generate GRR data and move them into a data table2 then generate graph XY Plot to mimic the customer graph below.
Data Table 1
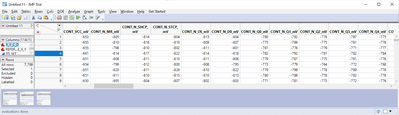
Data Table2
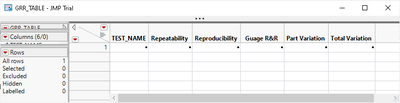
Final Graph
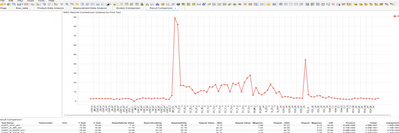
Right now im going step by step , i can generate the GRR , the new data tame but im stuck on how to get values from the report into the GRR table..
Im a total noob trying to go through the scripting manual... but cant find a specific example... thanks
/////////////////////////////////////////////////////////////////////////
Variability Chart(
    Y( :CONT_VCC_mV ),
    X( :X_Y ),
    Model( "Main Effect" ),
    Historical Sigma( 0 ),
    Name( "Gauge R&R" )(6, 0, 0, 0),
    Name( "Gauge R&R Report" )(1),
    SendToReport( Dispatch( {}, "Gauge R&R", OutlineBox, {Set Title( "Gauge R&R" )} ) )
);

dt = New Table( "GRR_TABLE" );

dt << New Column( "TEST_NAME" );
dt << New Column( "Repeatability" );
dt << New Column( "Reproducibility" );
dt << New Column( "Guage R&R" );
dt << New Column( "Part Variation" );
dt << New Column( "Total Variation" );

dt << Add Rows( 1 );


// Get test name
x = Column( "TEST_NAME" );
x[1] = "CONT_VCC_mV"; // How to get this from Chart...

//Get Repeatability
Y = Column( "Repeatability " );
x[2] = r[Outline Box( "Gauge R&R" ), Number Col Box( "Variation (6*StdDev)", 1 )] << get( 1 );

//Get Reproducibility
//Get Guage R&R
//Get Part Variation
//Get Total Variation
// XY, Plot results GRR_TABLE
- Mark as New
- Bookmark
- Subscribe
- Mute
- Subscribe to RSS Feed
- Get Direct Link
- Report Inappropriate Content
Re: Gauge R&R Report into a data table
Here is an example of what I think is pretty close to what you want
Names Default To Here( 1 );
dt = Open( "$SAMPLE_DATA/Variability Data/wafer.jmp" );
// Add some new columns to allow for the sample data
// table to look somewhat like your table
For( i = 2, i <= 5, i++,
	dt << New Column( "Y" || Char( i ), formula( Random Uniform( 80, 120 ) ) )
);

colList = dt << get column names( string, continuous );

// Create a starter data table for placing all of the results in
dtFinal = New Table( "Final Results Table" );

// Loop across all of the columns and extract the required data
For( i = 1, i <= N Items( colList ), i++,
	vc = dt << Variability Chart(
		invisible,
		Y( Eval( colList[i] ) ),
		X( :Operator, :Wafer ),
		Model( "Main Effect" ),
		Historical Sigma( 0 ),
		Name( "Gauge R&R" )(6, 0, 0, 0),
		Name( "Gauge R&R Report" )(1)
	);

	// Point at the report table you are interested in, and
	// pass the message to it to create the data table from it
	dtRR = Report( vc )["Gauge R&R"][Table Box( 1 )] << Make combined Data Table;

	dtFinal = dtFinal << concatenate( dtRR, append to first table( 1 ) );

	Close( dtRR, nosave );
);

// Make the transposed data table
dtReport = dtFinal << Split(
	Split By( :Measurement Source ),
	Split(
		:Name( "~AIAG abbrev" ),
		:Name( "Variation (6*StdDev)" ),
		:Name( "~AIAG Label" ),
		:Name( "which is 6*sqrt of" )
	),
	Group( :Y ),
	Sort by Column Property,
	Output Table("Guage R&R Report")
);
Also, the Scripting Guide is not a real good examples book, from the stand point of, "Here is how you do X". It is a document targeted to teach the language. So I suggest that you spend a bit more time with it and you will learn how to use it's components to generate your scripts.
- Mark as New
- Bookmark
- Subscribe
- Mute
- Subscribe to RSS Feed
- Get Direct Link
- Report Inappropriate Content
Re: Gauge R&R Report into a data table
Report( variability chart[1] )["GaugeR&R"][Table Box( 1 )] << make combined data table would only save the first column , i see now how its supposed to be done

- Mark as New
- Bookmark
- Subscribe
- Mute
- Subscribe to RSS Feed
- Get Direct Link
- Report Inappropriate Content
Re: Gauge R&R Report into a data table
This example is very helpful as a starting point for a scripting solution, but doesn't explain the arguments that are passed on the line below. (6,0,0,0), effects the analysis output as well as the calculated values, but I am not able to find where these arguments are defined or described.
Name( "Gauge R&R" )(6, 0, 0, 0),It appears that the second argument effects the % of Tolerance being included in the Report (0= this column not included, 1=this column is included). Where can I read up on these setting values and what they effect?


- Mark as New
- Bookmark
- Subscribe
- Mute
- Subscribe to RSS Feed
- Get Direct Link
- Report Inappropriate Content
Re: Gauge R&R Report into a data table
I cannot find any documentation about these Variability Chart() arguments. I entered a bug for this omission.

- Mark as New
- Bookmark
- Subscribe
- Mute
- Subscribe to RSS Feed
- Get Direct Link
- Report Inappropriate Content
Re: Gauge R&R Report into a data table
This is legacy code. In Version 17 and above, this has been replaced with Edit MSA Metadata.
If you look in a version of JMP prior to 17, you will find the following information in the Scripting Index:
obj<< "Gauge R&R"n( K Sigma, Tolerance, LSL, USL )
Computes and displays a gauge R&R (reproducibility and repeatability) summary report. Specify either the tolerance or the specification limits.
- Mark as New
- Bookmark
- Subscribe
- Mute
- Subscribe to RSS Feed
- Get Direct Link
- Report Inappropriate Content
Re: Gauge R&R Report into a data table
Thank you. I confirmed the Metadata ordering also. I looked in the V17 scripting guide (pdf and help) and didn't find the snippet you referenced. Either way, I am now able to pull in the Spec Limits from meta data which were previously loaded (PS: I only import LSL and USL) and the method works perfectly. A nice consolidated table of gage data. I just need to add a sort R&R high to low and done. Really appreciate the help.
colList = dt << get column names;

// Create a starter data table for placing all of the results in
dtFinal = New Table( "Final Results Table" );

Current Data Table( dt );
Limits={};
ncols = N Items(colList);
For( i = 3, i <=ncols, i++,
		Limits=:Column(colList[i])<<Get Property("Spec Limits");
		show(Column(colList[i]));

		vc = dt << Variability Chart(
			invisible,
			Y( Column(colList[i])),
			X( :Appraiser, :UUT ),
			Model( "Crossed" ),
//							   (sigma, TolRange,   LSL,         USL )
		    Name( "Gauge R&R" )(6,       0,      Limits[1],   Limits[2]),
		    Name( "Gauge R&R Report" )(1)
		);

		dtRR = Report( vc )["Gauge R&R"][Table Box( 1 )] << Make combined Data Table;
		dtFinal = dtFinal << concatenate( dtRR, append to first table( 1 ) );
		Close( dtRR, nosave );
		vc << close window;
		Current Data Table( dt );
);

dtReport = dtFinal << Split(
Split By( :"~AIAG abbrev"n ),
Split( :"% of Tolerance"n ),
Group( :Y ),
Output Table( "Gauge R&R Report" ),
Remaining Columns( Drop All ),
Sort by Column Property
);
Close( dtFinal, nosave );Recommended Articles
- © 2026 JMP Statistical Discovery LLC. All Rights Reserved.
- Terms of Use
- Privacy Statement
- Contact Us