- New to JMP? Join us Sept. 23-24 for the Early User Edition of Discovery Summit, tailor-made for new users. Register now for free!
- Use World Cup data to build models, explore spatial relationships, and create informative visualizations in JMP. Register. July 17, 2 pm US Eastern Time.
- Your voice matters! Tell us how you prefer to receive JMP updates, so we can tailor our communication to your needs. Take short survey.
- Subscribe to RSS Feed
- Mark Topic as New
- Mark Topic as Read
- Float this Topic for Current User
- Bookmark
- Subscribe
- Mute
- Printer Friendly Page
Discussions
Solve problems, and share tips and tricks with other JMP users.- JMP User Community
- :
- Discussions
- :
- Flowchart in JSL

- Mark as New
- Bookmark
- Subscribe
- Mute
- Subscribe to RSS Feed
- Get Direct Link
- Report Inappropriate Content
Flowchart in JSL
Hi,
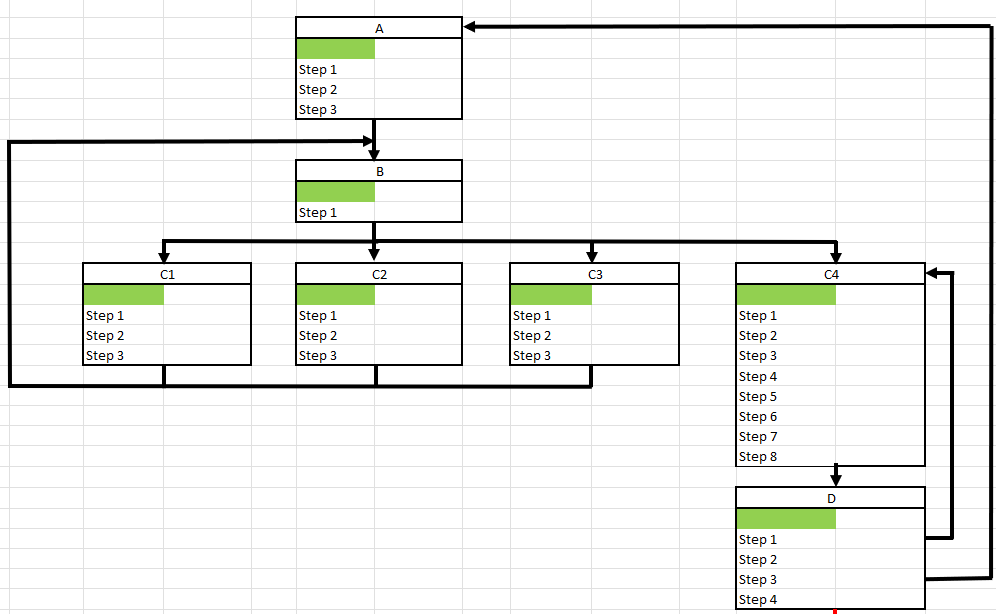
I'd like to draw a flowchart in JSL (cf. attachment) using a From/To table. A bit like Visio.
I've tried the Diagram option but the Cause/Effect fishbone doesn't give the same thing.
Do you know if it's possible?
Thank you

- Mark as New
- Bookmark
- Subscribe
- Mute
- Subscribe to RSS Feed
- Get Direct Link
- Report Inappropriate Content
Re: Flowchart in JSL
GraphBuilder Powers for Fishbone/hierarchical Diagram Platform seems to be accumulating these requests; it would be great if you could elaborate on your need there.
- a platform solution?
- scriptable with JSL?
- what sort of input drives it?
- run it again with new data and automatically lay out the nodes and connections?
@MathStatChem points out there is a need for more than the simple acyclic fishbone graphs, such as the one you show with loops. @LauraCS might have some insight here as well; Structural Equation Modeling: The arrival of a powerful new framework in JMP Pro 15 has a diagram which I think can include loops, though it is application specific.

- Mark as New
- Bookmark
- Subscribe
- Mute
- Subscribe to RSS Feed
- Get Direct Link
- Report Inappropriate Content
Re: Flowchart in JSL
The SEM platform can build highly customizable path diagrams but it won't allow you to include content inside the nodes beyond a label (which comes from a column name in the data table). Indeed, because the diagram is application specific, the nodes aren't designed to fit a lot of content.
You can try running the JSL below to see it for yourself. As a side note, you can specify the diagram interactively using From/To lists if you just run the first two lines of the script. You'll be able to connect nodes with double-headed arrows and can use the context menu in the diagram to find the "Customize Diagram..." menu.
// Create data for use in the structural equation models platform
mat = J(50, 7, Random Normal());
As Table(mat, << Column Names({"A", "B", "C1", "C2", "C3", "C4", "D"})) << Set Name("Flow Chart");

// Launch SEM and specify diagram
obj = Structural Equation Models(Model Variables(1::7));
obj << Model Specification(
	Regressions( // lists follow "from-to" convention
		{:A,{:B}},
		{:B, {:C1, :C2, :C3, :C4}},
		{:C1, {:B}},
		{:C2, {:B}},
		{:C3, {:B}},
		{:C4, {:D}},
		{:D, {:C4, :A}}
	),
	Path Diagram Properties(
		Manifest Shape({Width(70), Height(40)}),
		Layout("Top to Bottom")
	)
);
You can get a quick overview of what the SEM platform is meant to do here:
https://www.jmp.com/en/statistics-knowledge-portal/structural-equation-modeling
HTH,
~Laura
Recommended Articles
- © 2026 JMP Statistical Discovery LLC. All Rights Reserved.
- Terms of Use
- Privacy Statement
- Contact Us