- New to JMP? Let the Data Analysis Director guide you through selecting an analysis task, an analysis goal, and a data type. Available now in the JMP Marketplace!
- See how to install JMP Marketplace extensions to customize and enhance JMP.
- Subscribe to RSS Feed
- Mark Topic as New
- Mark Topic as Read
- Float this Topic for Current User
- Bookmark
- Subscribe
- Mute
- Printer Friendly Page
Discussions
Solve problems, and share tips and tricks with other JMP users.- JMP User Community
- :
- Discussions
- :
- Re: Fit Models (Responses compared to reference, Mixture)

- Mark as New
- Bookmark
- Subscribe
- Mute
- Subscribe to RSS Feed
- Get Direct Link
- Report Inappropriate Content
Fit Models (Responses compared to reference, Mixture)
Hello all,
I have started to use jmp recently to learn how to plan experiments. So far I did some trials, but I have problems with all the different options and data arrangements when building models. I share some data to show you where I stuck:
Experiment 1:
3 Factors (Mixture Component 1, Mixture Component 2, Continous Factor 1), 9 Experiments
3 Responses (only 2 in the data sheet; aim: maximize)
My first questions are about the responses:
The responses are measured as the difference to the values before the experiment (also a mean of several measurements) and I dont know how to add this information to the data to build the model (in the sheet I just substracted the mean to have something start with).
I am also not sure if I need to add the experiment number to the model. Is it assumed that data come from different experiments if I do not?
The other part I am wondering about is how to deal with the mixture components in the model. In that particular example I have only 2 components, so is it necessary to fit it as mixture model?. Mixture component 1 does not seem to effect the response, but it seems not correct to remove a mixture factor from a model.
Hope you can help me with that. I added the data and some plots I made.
I have only used the interactive tools so far.
Anna

- Mark as New
- Bookmark
- Subscribe
- Mute
- Subscribe to RSS Feed
- Get Direct Link
- Report Inappropriate Content
Re: Fit Models (Responses compared to reference, Mixture)
I have some thoughts, but I'm not sure exactly what you are asking:
1. It appears you have 9 treatment combinations which is a fractional factorial of the 3^3 design, but I'm not sure how you chose the treatments you did? Typically when designing an experiment, you will start with an idea of the model you want to investigate. This is usually derived from the hypotheses you have regarding what factors effects the response variables. I don't know what model you are investigating, but the design you chose for 9 treatments could have been chosen better. You have confounded or partially aliased terms in your experiment.

2. You have multiple measures for each treatment. I don't know if these are repeated measures or replicates as there is no run order in your data table. Even so, one treatment has 6 responses, the others have 10.
3. If you want the delta change from before treatments to after, just add a column for that contains the measures before and then create a column which is a formula that calculates the delta.
4. You use the term "mixture" component? Are there any constraints? There are multiple schools of thought regarding mixture designs (I suggest you read Cornell "Experiments with Mixtures".) For example, are there other components of processing that are not part of the "mixture batch" like agitation rate or temperature? You may want to investigate these factors as well. Some times you can start with ratios of components. Mixture designs are a special case of experimentation. This is because changes in the levels of one mixture factor necessitates changes in the levels for the other mixture components (usually the components must some to 1). , hence some of the orthogonal properties of the experiment are compromised. I usually think of mixture designs as optimization type experiments. Typically, this means you have already defined the first order model and completely understand noise effects. You will be analyzing response surfaces to determine where the best area is to work. But it doesn't do any good if the surface is the base of the mountain you are trying to climb.
Maybe start here:
https://www.jmp.com/en_us/events/mastering/topics/mixture-designs.html
5. No, you should not add experiment number to the model. It would be advised to keep track of run order as often we will sort in run order when evaluating the residuals of the model.
Lastly, I would suggest you start with some basic understanding of experimentation. JMP offers some on-line options to learn about experimentation:
https://www.jmp.com/en_us/online-statistics-course/design-of-experiments.html
- Mark as New
- Bookmark
- Subscribe
- Mute
- Subscribe to RSS Feed
- Get Direct Link
- Report Inappropriate Content
Re: Fit Models (Responses compared to reference, Mixture)
Thank you for your response! I will try to make it clearer.
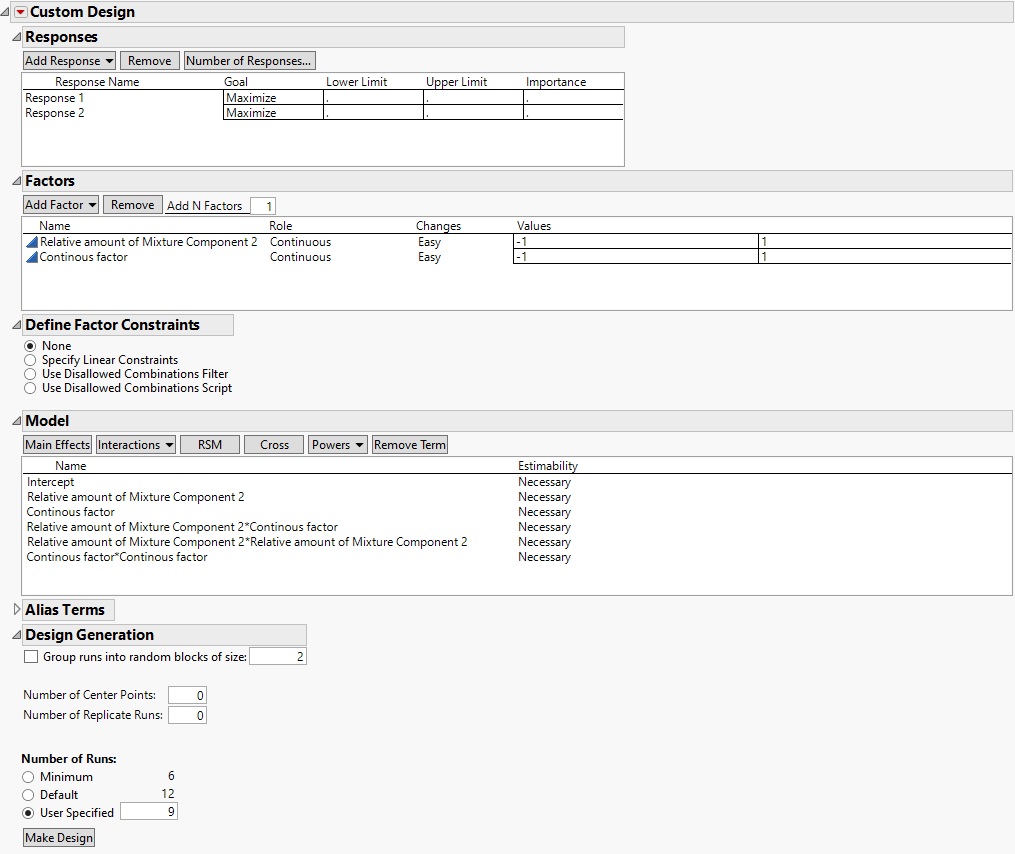
1. I have used the custom design in jmp, but when I did that I assumed only 2 continuous factors: the relative amount of the mixing component 2 and the continuous factor. Only later when I wanted to vary a third factor I realized that this must be described as a mixture, to get realistic combinations. This is why I wondered if it needs to be treated it as a mixture.
Anyway my design inputs are attached in the design picture. So 2 factors, interaction and quadratic terms. I choose 9 experiments because all terms were non aliased with that approach.
2. The responses are repeated measures, so the responses were measured on 10 or 6 samples (response 1) and 3 samples (response 2), which is a random sample from each experiment. And my question is how can I transfer that information, when fitting a model? Its a bit ugly that the number of measurements is not the same for each experiments, but this could be fixed (but in reality I deal often with missing data points).
3. I have data from before experiments, but those are not the same samples as the ones measured after experiments. Also, there are not always the same number of samples measured before and after. For data visualization I would calculate the differences of the means and the confidence interval, but I dont know how to get that information into the model. In the table I calculated delta by subtracting the mean of the reference from the measured responses, but that ignores the uncertainty of the reference data.
4. There are no constraints for the 2 mixture components, actually there are 3 components, but the 3rd is constant in that case (mixture component 3/ (mixture component 1 + mixture component 2) = const). Thanks for the references, I will read into that and try to understand what can be applied in this case. And yes, there are also uncontrolled factors in that experiment. Obviously they are considered not to effect the outcome, but there are no systematic data for that, so honestly I don’t know (difficult to say if it is worth investigating those, need to study more on this).
5. That question was related to, how to assign the responses to 1 experiment and not treat it as several repeated experiments.
Thanks for your time already!
Anna
- Mark as New
- Bookmark
- Subscribe
- Mute
- Subscribe to RSS Feed
- Get Direct Link
- Report Inappropriate Content
Re: Fit Models (Responses compared to reference, Mixture)
My follow up thoughts:
1. Unfortunately the 3rd factor you added was not added to the matrix orthogonally and therefore you ended up with confounded main effects in your initial post.
I'm nit sure I understand you logic about why it has to be considered a mixture...Again mixtures are a special case of experimentation where there are constraints on the level-setting. You suggest there are no constraints, so you don't have a mixture problem. A factorial problem perhaps.
2. Repeated measures are an excellent strategy top deal with within treatment variability (short-term noise). However, they may not be analyzed as if they are independent responses (they do not add DF's). You can certainly graph the repeated measures for each treatment and assess their consistency, then summarize the repeated measures to calculate the appropriate enumerative statistics (e.g., mean, standard deviation, median). You always want to look at that data to see if there are any unusual data points before summarizing that data. If you have the repeated measures in separate columns in JMP, then stack those columns, use graph builder or variability plots to graph the within treatment data. Then use Tables>Summary to calculate the appropriate statistics for each treatment.
3. Since you don't have one-to-one comparisons, then using some summary statistic before and actual values after may be OK. Add a column in JMP for the statistics before (one column for each response) and then create a formula column that subtracts the after response from the before response columns.
4. You hope the noise doesn't have an effect, but have you studied it and quantified it? If not, your inference space will be limited and your models will also be limited in their predictive ability.
It really helps to add the JMP data table instead of screen shots.
- Mark as New
- Bookmark
- Subscribe
- Mute
- Subscribe to RSS Feed
- Get Direct Link
- Report Inappropriate Content
Re: Fit Models (Responses compared to reference, Mixture)
Thanks for the explanations.
There is maybe a mistake in my logic because I still dont get that mixture definition. I have 2 components that I added in a series of experiments in different ratios, I could describe that as the relative amount of one of those components (that was my first reasoning). Then I saw some examples that applied mixtures in their models, so i thought that applies for my experiment as well, because if I have x% of one component I need to have 100-x% of the other component (but no constraints for the upper and lower bounds) . So that would be a mixture from my understanding. I am quite confused now, not sure I explained it well.
- Mark as New
- Bookmark
- Subscribe
- Mute
- Subscribe to RSS Feed
- Get Direct Link
- Report Inappropriate Content
Re: Fit Models (Responses compared to reference, Mixture)
I apologize if I have somehow confused you, and perhaps I have misinterpreted your situation. In the response you provide, there is a dichotomy. You say the total must add to 100 and therefore when you have x% of component 1 you must have 100-x% for component 2. This IS a mixture problem, but then you say there are no constraints "(but no constraints for the upper and lower bounds)"...there are. You can't independently change x% of component 1 without impacting the % of component 2. That is a constraint.
Recommended Articles
- © 2026 JMP Statistical Discovery LLC. All Rights Reserved.
- Terms of Use
- Privacy Statement
- Contact Us