cancel
Showing results for 
Show  only  | Search instead for 
Did you mean: 
  • Don’t miss your chance to experience Discovery Summit Europe at our best available rate! Early bird registration through 31 Oct.
  • Graph Builder Toolbar streamlines interactive graphing. Creates shortcuts on Report and GraphBuilder Helpers toolbars. Download and install the extension.
  • JMP will suspend normal business operations for our Rest and Recharge Day on Friday, October 2, 2026.
    Regular business hours will resume on Monday, October 5, 2026.

Discussions

Solve problems, and share tips and tricks with other JMP users.
Choose Language Hide Translation Bar
Rily_Maya
Level III

Fit Life by X,Devalt.jmp,Parameter correlation

The JMP sample data file "Devalt.jmp" is included with the software. If you select the Weibull distribution" and perform the analysis using "Fit Life by X", the correlation between β0 and β1 in the results is -0.999188, indicating a very strong correlation. Is this acceptable? What impact does it have on the results, and is it significant?

How can the robustness of this predictive model be evaluated?
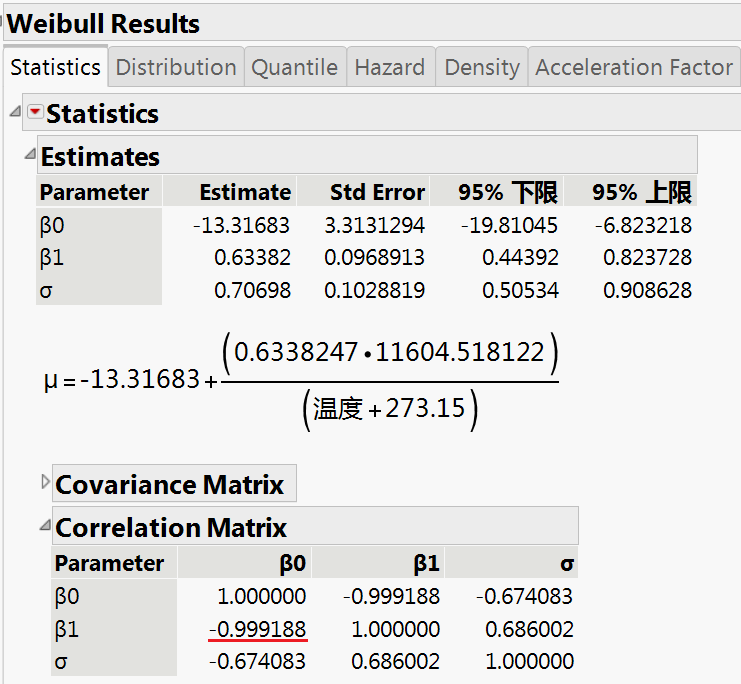
Correlation Matrix.png

0 REPLIES 0

Recommended Articles
