- Subscribe to RSS Feed
- Mark Topic as New
- Mark Topic as Read
- Float this Topic for Current User
- Bookmark
- Subscribe
- Mute
- Printer Friendly Page
Discussions
Solve problems, and share tips and tricks with other JMP users.- JMP User Community
- :
- Discussions
- :
- Finding the X range that will include a certain portion of the Y

- Mark as New
- Bookmark
- Subscribe
- Mute
- Subscribe to RSS Feed
- Get Direct Link
- Report Inappropriate Content
Finding the X range that will include a certain portion of the Y
Hi,
My problem is probably very simple but I just don't seem to be able to figure it out.
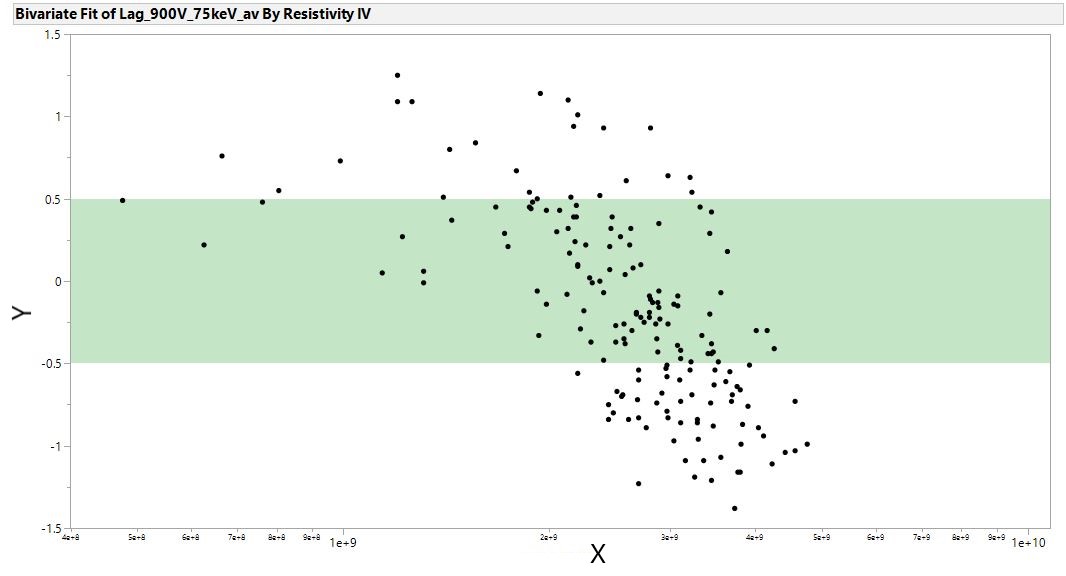
I have a column Y that I have plotted it vs column X and it looks something like the attached image.
I want to find the range in X where it yields (or includes) 60% of Y points. There is no defind formula that relates the 2 columns.
Any ideas?

Accepted Solutions

- Mark as New
- Bookmark
- Subscribe
- Mute
- Subscribe to RSS Feed
- Get Direct Link
- Report Inappropriate Content
Re: Finding the X range that will include a certain portion of the Y
Hi @NSadeghi
please have a look at this script and let us know if it is useful.
perhaps someone else has a more elegant way of doing this. i would also like to know
Names Default To Here( 1 );

dt = Open( "$SAMPLE_DATA/Big Class.jmp" );

// this is just in case you want to bring the data back to original row order later.
rowcol = New Column("Row", Numeric, "Continuous", Format("Best", 12), Formula(Row()));
dt << run formulas();
rowcol << suppress eval( true );

// now we start working
dt << Sort( By( :height ), Order( Ascending ), replace table );

// here is where we define the share of included range (0.6)
difcol = New Column("dif", Numeric, "Continuous", Format("Best", 12), Formula(Abs(:height - Lag(:height, -(N Rows() * 0.6)))));
dt << run formulas();
difcol << suppress eval( true );

start  = (dt<<get rows where(Col minimum (:dif)==:dif))[1];
// here we also mantion the share of included range (0.6)
end = start + nrows(dt)*0.6 -1;

// new binary column for in or out the range
dt << New Column("inrange", Numeric, "Ordinal");
for each row (:inrange = if (and (row() >= start, row()<=end),1 ,0  ));

// make graphs for observations in the range only.
Bivariate( Y( :height ), X( :weight ), Where( :inrange == 1 ) );

Graph Builder(
	Size( 542, 448 ),
	Show Control Panel( 0 ),
	Variables( X( :weight ), Y( :height ) ), Where( :inrange == 1 ),
	Elements( Points( X, Y, Legend( 3 ) ), Smoother( X, Y, Legend( 4 ) ) )
);
- Mark as New
- Bookmark
- Subscribe
- Mute
- Subscribe to RSS Feed
- Get Direct Link
- Report Inappropriate Content
Re: Finding the X range that will include a certain portion of the Y
You find, select, and subset the rows containing the (middle) 60% of the Y values, and then examine the distribution of the associated X values.
Names Default to Here( 1 );

dt 1 = Open( "$SAMPLE_DATA/Big Class.jmp" );

biv = dt 1 << Bivariate( Y( :weight ), X( :height ) );

lo = Col Quantile( :weight, 0.2 );
hi = Col Quantile( :weight, 0.8 );

dt 1 << Select Where( lo <= :weight <= hi );

dt 2 = dt 1 << Subset(
	Selected Rows( 1 ),
	Selected columns only( 0 )
);

dist = dt 2 << Distribution( Y( :height ) );
- Mark as New
- Bookmark
- Subscribe
- Mute
- Subscribe to RSS Feed
- Get Direct Link
- Report Inappropriate Content
Re: Finding the X range that will include a certain portion of the Y
You could try including histogram borders and highlighting the section of the Y distribution - the X values should be highlighted. Then, if you want to examine these, you can name that selection in a column of the data set (e.g., points of interest) for further analysis.
- Mark as New
- Bookmark
- Subscribe
- Mute
- Subscribe to RSS Feed
- Get Direct Link
- Report Inappropriate Content
Re: Finding the X range that will include a certain portion of the Y
Hi @NSadeghi
please have a look at this script and let us know if it is useful.
perhaps someone else has a more elegant way of doing this. i would also like to know
Names Default To Here( 1 );

dt = Open( "$SAMPLE_DATA/Big Class.jmp" );

// this is just in case you want to bring the data back to original row order later.
rowcol = New Column("Row", Numeric, "Continuous", Format("Best", 12), Formula(Row()));
dt << run formulas();
rowcol << suppress eval( true );

// now we start working
dt << Sort( By( :height ), Order( Ascending ), replace table );

// here is where we define the share of included range (0.6)
difcol = New Column("dif", Numeric, "Continuous", Format("Best", 12), Formula(Abs(:height - Lag(:height, -(N Rows() * 0.6)))));
dt << run formulas();
difcol << suppress eval( true );

start  = (dt<<get rows where(Col minimum (:dif)==:dif))[1];
// here we also mantion the share of included range (0.6)
end = start + nrows(dt)*0.6 -1;

// new binary column for in or out the range
dt << New Column("inrange", Numeric, "Ordinal");
for each row (:inrange = if (and (row() >= start, row()<=end),1 ,0  ));

// make graphs for observations in the range only.
Bivariate( Y( :height ), X( :weight ), Where( :inrange == 1 ) );

Graph Builder(
	Size( 542, 448 ),
	Show Control Panel( 0 ),
	Variables( X( :weight ), Y( :height ) ), Where( :inrange == 1 ),
	Elements( Points( X, Y, Legend( 3 ) ), Smoother( X, Y, Legend( 4 ) ) )
);- Mark as New
- Bookmark
- Subscribe
- Mute
- Subscribe to RSS Feed
- Get Direct Link
- Report Inappropriate Content
Re: Finding the X range that will include a certain portion of the Y
You find, select, and subset the rows containing the (middle) 60% of the Y values, and then examine the distribution of the associated X values.
Names Default to Here( 1 );

dt 1 = Open( "$SAMPLE_DATA/Big Class.jmp" );

biv = dt 1 << Bivariate( Y( :weight ), X( :height ) );

lo = Col Quantile( :weight, 0.2 );
hi = Col Quantile( :weight, 0.8 );

dt 1 << Select Where( lo <= :weight <= hi );

dt 2 = dt 1 << Subset(
	Selected Rows( 1 ),
	Selected columns only( 0 )
);

dist = dt 2 << Distribution( Y( :height ) );Recommended Articles
- © 2025 JMP Statistical Discovery LLC. All Rights Reserved.
- Terms of Use
- Privacy Statement
- Contact Us