- Subscribe to RSS Feed
- Mark Topic as New
- Mark Topic as Read
- Float this Topic for Current User
- Bookmark
- Subscribe
- Mute
- Printer Friendly Page
Discussions
Solve problems, and share tips and tricks with other JMP users.- JMP User Community
- :
- Discussions
- :
- Re: Example of Constructing a Summary Results Report ?
- Mark as New
- Bookmark
- Subscribe
- Mute
- Subscribe to RSS Feed
- Get Direct Link
- Report Inappropriate Content
Example of Constructing a Summary Results Report ?
Hi All,
i want to produce a summary table as shown on the left. but the JSL code (attached) have produced result as on the right.
- Mark as New
- Bookmark
- Subscribe
- Mute
- Subscribe to RSS Feed
- Get Direct Link
- Report Inappropriate Content
Re: Example of Constructing a Summary Results Report ?
You need to use the Tabulate Platform to generate the output you want
Analyze==>Tabulate
Tabulate(
	Show Control Panel( 0 ),
	Add Table(
		Column Table(
			Analysis Columns( :height, :weight ),
			Statistics( Min, Mean, Max )
		),
		Row Table( Grouping Columns( :sex, :age ) )
	)
)
I have been following the plethera of entries you have generated in the Discussion Forum. It is my evaluation of what I have seen, is that you take the feedback you get, and understand it, and learn from it. However, what I also believe, is that you have not taken the time to learn from the excellent documentation that JMP provides, before you ask the JMP Community to solve your problem.
Help==>books==> Using JMP, Basic Analysis and Essential Graphics
Need to be read and absorbed. Gaining that knowledge will give you the answers, or at least pointers towards the answers you repeatedly keep asking of the Discussion Forum. It will allow you to not have to wait for the Community to respond.
- Mark as New
- Bookmark
- Subscribe
- Mute
- Subscribe to RSS Feed
- Get Direct Link
- Report Inappropriate Content
Re: Example of Constructing a Summary Results Report ?
Hi txnelsion,
appreciate your reply. But looks like tabulate can not meet the requirement. below are the differences.
1. tabulate can not be copied and paste in excel or in ppt.
2. it changes the order. e.g F comes first than M even if M is first in the original table.
3. it still have all the rows in every column.
this is not what i am looking for.
Thanks
ram
- Mark as New
- Bookmark
- Subscribe
- Mute
- Subscribe to RSS Feed
- Get Direct Link
- Report Inappropriate Content
Re: Example of Constructing a Summary Results Report ?
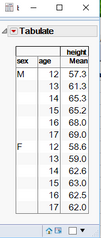
I find your responses to be incorrect. I generated this very simple Tabulate:
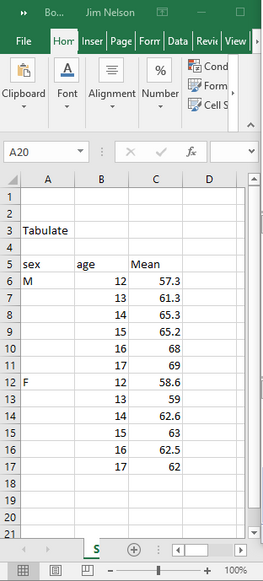
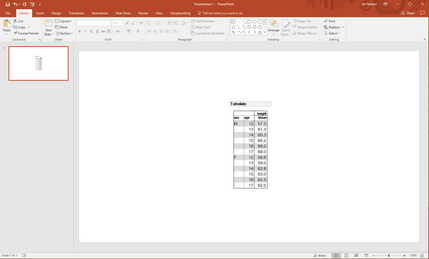
1. Here are the results of copying the above to Excel and ppt
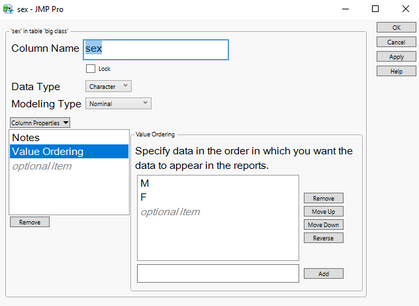
2. The default ordering of the Sex column in my example, is "F" followed by "M", however, if you use the Value Ordering column property, you can change the order to whatever you want
The ordering can also be set to "Row Order Levels", which would order the values based upon the order the data are first found in the data table.
3. And as can be seen in both the excel and powerpoint the Row Values for the column Sex are not repeated.
- Mark as New
- Bookmark
- Subscribe
- Mute
- Subscribe to RSS Feed
- Get Direct Link
- Report Inappropriate Content
Re: Example of Constructing a Summary Results Report ?
Ok, I will take back comments 1 and 2. i will try again to copy paste. i must have been doing something wrong.
how about the comment 3. same value rows are not merged in column "sex".
my end goal is to generate the score card using jsl and have same value columns merged.
currently i am following 2 step method:
1. generating score card using JSL.
2. save in .xlsx using JSL
3. using VBA to merge the same value columns as described on this link.(https://www.extendoffice.com/documents/excel/1138-excel-merge-same-value.html)
it will be great help if tabulate can do the same thing and maintain the merged cells even after pasting into excel or ppt.
Thanks
Ram
Recommended Articles
- © 2026 JMP Statistical Discovery LLC. All Rights Reserved.
- Terms of Use
- Privacy Statement
- Contact Us


