- Don’t miss your chance to experience Discovery Summit Europe at our best available rate! Early bird registration through 31 Oct.
- Graph Builder Toolbar streamlines interactive graphing. Creates shortcuts on Report and GraphBuilder Helpers toolbars. Download and install the extension.
- Subscribe to RSS Feed
- Mark Topic as New
- Mark Topic as Read
- Float this Topic for Current User
- Bookmark
- Subscribe
- Mute
- Printer Friendly Page
Discussions
Solve problems, and share tips and tricks with other JMP users.- User Community
- :
- Discussions
- :
- Differing P Values

- Mark as New
- Bookmark
- Subscribe
- Mute
- Subscribe to RSS Feed
- Get Direct Link
- Report Inappropriate Content
Differing P Values
Hello!
I used the software for a fractional factorial screening design. I had three different factors to evaluate all of which were categorical. My data was collected/recorded using Pass or Fail for the one Response. I am trying to find the proper way to analyze this data. I am trying to get data that shows which factor had the most effect on the Pass or Fail Rate of the Response
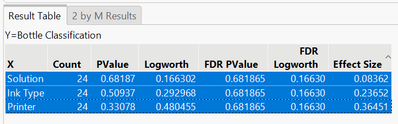
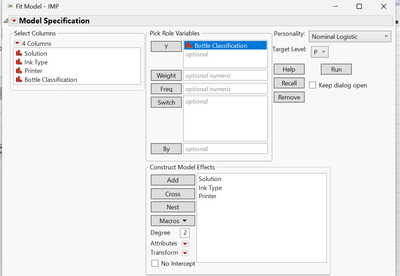
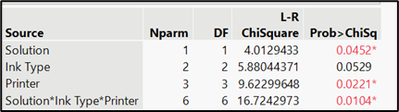
I saw a tutorial online that said to just right click model and hit run script. I then changed the personality to to Response Screening After running the script I got a table which is Photo A below. I think for my purposes the Effect Size column is probably the most important. But I am confused because I followed another method one of my team members uses which is going to Analyze and Fit Model and I have included a screenshot below of what the Set Up looks like [Photo B] and the results are in photo C but there is a significant difference between the P Values recorded and I am unsure of why there is a significant different and which would be considered correct.
Thanks in advance!
Accepted Solutions


- Mark as New
- Bookmark
- Subscribe
- Mute
- Subscribe to RSS Feed
- Get Direct Link
- Report Inappropriate Content
Re: Differing P Values
The Response Screening runs 3 independent analyses, where the Fit Model takes all 3 factors into account when analyzing the data.
- Mark as New
- Bookmark
- Subscribe
- Mute
- Subscribe to RSS Feed
- Get Direct Link
- Report Inappropriate Content
Re: Differing P Values
The Response Screening runs 3 independent analyses, where the Fit Model takes all 3 factors into account when analyzing the data.
Recommended Articles
- © 2026 JMP Statistical Discovery LLC. All Rights Reserved.
- Terms of Use
- Privacy Statement
- Contact Us