Turn on suggestions
Auto-suggest helps you quickly narrow down your search results by suggesting possible matches as you type.
- New to JMP? Join us Sept. 23-24 for the Early User Edition of Discovery Summit, tailor-made for new users. Register now for free!
- Learn some foundational elements of JMP Scripting Language (JSL) and how to extend point & click automation into repeatable, shareable routines. Register. June 26, 2 p.m. US Eastern Time.
Options
- Subscribe to RSS Feed
- Mark Topic as New
- Mark Topic as Read
- Float this Topic for Current User
- Bookmark
- Subscribe
- Mute
- Printer Friendly Page
Discussions
Solve problems, and share tips and tricks with other JMP users.- JMP User Community
- :
- Discussions
- :
- Differences in Control Chart Builder Syntax and Chart Display Across JMP Version...

Level II
- Mark as New
- Bookmark
- Subscribe
- Mute
- Subscribe to RSS Feed
- Get Direct Link
- Report Inappropriate Content
Differences in Control Chart Builder Syntax and Chart Display Across JMP Versions
Oct 31, 2025 04:44 AM
(1320 views)
I found that different versions of JMP display different charts when running the following script.
It seems that the syntax of the Control Chart Builder has changed, but I don't know how to fix it.
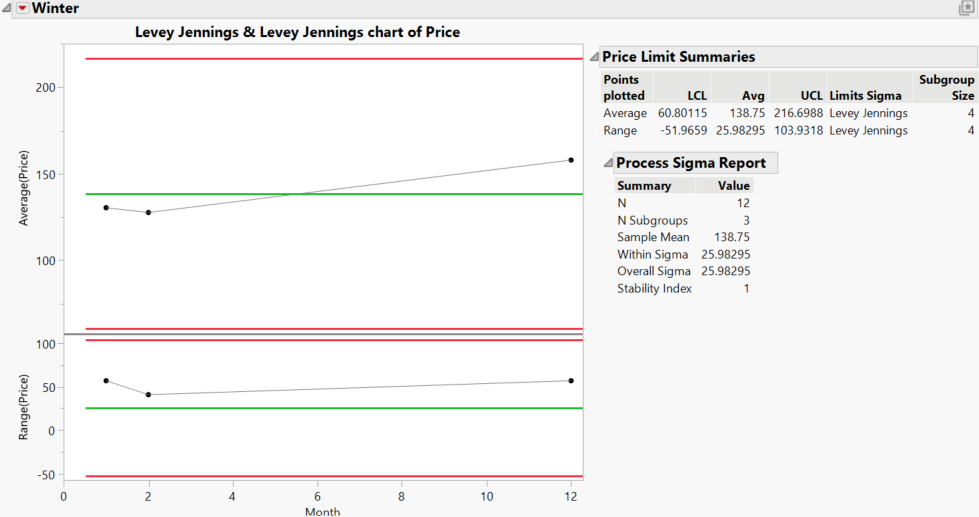
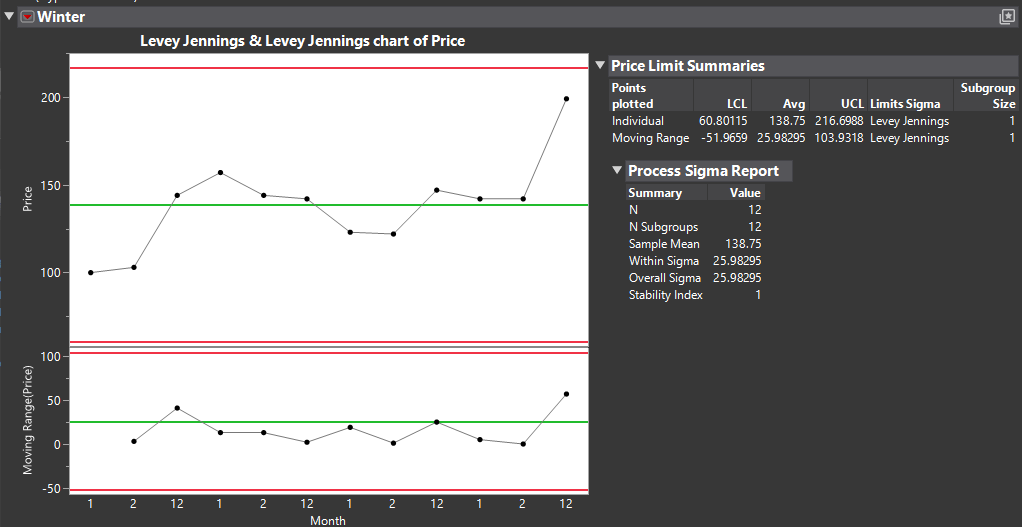
What I need is for version 18.0.1 to automatically average the prices for the same month, rather than, like the new version, simply outputting all the numbers.
Bright background figure is the result from version 18.0.1
Dark background figure is result from version 19.0.1
It seems that the syntax of the Control Chart Builder has changed, but I don't know how to fix it.
What I need is for version 18.0.1 to automatically average the prices for the same month, rather than, like the new version, simply outputting all the numbers.
dt= current datatable();
WinterChart = dt << Control Chart Builder(
	Show Sigma Report( 1 ),
	Variables( Y( :Price ), Subgroup( :Month ) ),
	Chart( Position( 1 ), Limits( Sigma( "Levey Jennings" ) ) ),
	Chart( Position( 2 ), Limits( Sigma( "Levey Jennings" ) ) ),
	Show Control Panel( 0 ),
	Where( :Type == "Winter" ),
	SendToReport( Dispatch( {}, "Control Chart Builder", OutlineBox, {Set Title( "Winter" )} ) )
);
Bright background figure is the result from version 18.0.1
Dark background figure is result from version 19.0.1
1 ACCEPTED SOLUTION
Accepted Solutions

Super User
Solution
- Mark as New
- Bookmark
- Subscribe
- Mute
- Subscribe to RSS Feed
- Get Direct Link
- Report Inappropriate Content
Re: Differences in Control Chart Builder Syntax and Chart Display Across JMP Versions
For these to be same for both version, you have to enable Sort By Subgroup in JMP19
Sort by Subgroup(1)If you wish to have similar result in JMP18, create new column (or use transform column) with formula Row() and use that as your x-axis
JMP19 with Sort by Subgroup(1) (similar as your old.png)

JMP18 with Row (similar as your shot.png but much better (in my opinion) x-axis)

-Jarmo
3 REPLIES 3
Super User
Solution
- Mark as New
- Bookmark
- Subscribe
- Mute
- Subscribe to RSS Feed
- Get Direct Link
- Report Inappropriate Content
Re: Differences in Control Chart Builder Syntax and Chart Display Across JMP Versions
For these to be same for both version, you have to enable Sort By Subgroup in JMP19
Sort by Subgroup(1)If you wish to have similar result in JMP18, create new column (or use transform column) with formula Row() and use that as your x-axis
JMP19 with Sort by Subgroup(1) (similar as your old.png)
JMP18 with Row (similar as your shot.png but much better (in my opinion) x-axis)
-Jarmo
Level II
- Mark as New
- Bookmark
- Subscribe
- Mute
- Subscribe to RSS Feed
- Get Direct Link
- Report Inappropriate Content
Re: Differences in Control Chart Builder Syntax and Chart Display Across JMP Versions
If I append "WinterChart<< Sort by Subgroup( 1 );" below, it does make the subgroup display correctly.
However, the original program has the setting "Chart( Position( 1 ), Limits( Sigma( "Levey Jennings" ) ) )," which allows the limits to be calculated using 3 sigma.
But with the result of Sort by Subgroup( 1 ), the chart still shows as an R Chart.
How should I adjust it so that when "Sort by Subgroup( 1 )" is applied, it can still display the sigma limits based on "Levey Jennings"?
Super User
- Mark as New
- Bookmark
- Subscribe
- Mute
- Subscribe to RSS Feed
- Get Direct Link
- Report Inappropriate Content
Re: Differences in Control Chart Builder Syntax and Chart Display Across JMP Versions
Change it from Limits settings?

-Jarmo
Recommended Articles
- © 2026 JMP Statistical Discovery LLC. All Rights Reserved.
- Terms of Use
- Privacy Statement
- Contact Us