- New to JMP? Join us Sept. 23-24 for the Early User Edition of Discovery Summit, tailor-made for new users. Register now for free!
- Your voice matters! Tell us how you prefer to receive JMP updates, so we can tailor our communication to your needs. Take short survey.
- See how to access JMP Marketplace - and - find, create & share add-ins to extend your JMP. Watch video.
- Subscribe to RSS Feed
- Mark Topic as New
- Mark Topic as Read
- Float this Topic for Current User
- Bookmark
- Subscribe
- Mute
- Printer Friendly Page
Discussions
Solve problems, and share tips and tricks with other JMP users.- JMP User Community
- :
- Discussions
- :
- Re: DOE - replicates vs. repetitions

- Mark as New
- Bookmark
- Subscribe
- Mute
- Subscribe to RSS Feed
- Get Direct Link
- Report Inappropriate Content
DOE - replicates vs. repetitions
I need to to design an experiment to determine temperature - Temp influence on pH.
Let's assume, temperature is a continuous variable in range [20,23].
And pH is continuous as well, good within range [5,7], but perfect in the center.
On a daily basis, in normal conditions we measure every sample 3 times (pseudoreplicates).
Is 3 in this case number of replicates I should use in JMP? Or it's only repetition and I should take the mean value, instead of 3 results?
Should I use a "Center point"?
Is 3 (pseudoreplicates) the number, which I should use in field:"Replicate Runs"?
Find attached screens from JMP DoE, to show you my attempts.
Accepted Solutions

- Mark as New
- Bookmark
- Subscribe
- Mute
- Subscribe to RSS Feed
- Get Direct Link
- Report Inappropriate Content
Re: DOE - replicates vs. repetitions
Yes, I would model the mean pH versus the temperature. Yes, the optimum design for a linear response uses just two factor levels.
Be sure that the temperature range is wide enough to produce a large change in the pH but not so wide as to change the nature of the phenomenon you are studying. The point of the design is the modeling. You might think in terms of a narrow range in which you obtain the desired pH. You should think in terms of large change in the response produced by a wider range of temperature. This kind of design will give you more precise and more stable estimates of the trend that you want. This case is experimenting and modeling, not just testing. This case is predicting, not 'pick the winner.'
The last point goes to your final question. We talk about the power in a design. The power is the probability that you will find a real effect (i.e., linear trend) to be statistically significant. Let's say that there is a real linear trend but due to a small sample size you often do not find it to be significant. Such outcomes are false negative results. Power is about the opposite: true positives. The statistical decision in a hypothesis test could be described as deciding if the change in the response is much greater than the change due to random variation in the response.
JMP provides a power analysis built into the design platform. I will illustrate how to use it with an example. I open DOE > Custom Design, change the response name to pH and the goal to None. I add a single continuous factor Temperature with a range -1 to +1 (I don't know the actual range). I click Continue and accept the default model for a linear response to Temperature. I decided to start with 8 runs (user defined) and click Make Design. How will this design perform?
Let's say that when the Temperature does not vary that the pH varies as a normal distribution with a standard deviation of 0.2 pH. Let's also say that we anticipate that the pH will minimally change from 6.4 to 7.0 over the range of Temperature in this design. We are now ready to analyze the power in this design.
Open the Power Analysis outline that is within the Design Evaluation outline. There are two equivalent ways to analyze the power. I will show you both of them. First, enter 0.2 for the Anticipated RMSE (response standard deviation). Now, either enter the Anticipated Coefficients or the Anticipated Response. The Anticipated Coefficient is the effect divided by 2. We expect a minimal effect of 7.0 - 6.4 = 0.6 pH so the anticipated coefficient is 0.3. Alternatively, enter 6.4 as the Anticipated Response whenever Temperature = -1 and 7.0 when Temperature = +1. Click either one of the Apply Changes buttons after entering this information.
The custom design should look like this:

If your expectations are right, then the power is 0.939 and you should find an effect of 0.6 pH or greater to be statistically significant practically all the time using this design.
I made up numbers for this example. Try to translate the illustration into your specific case and see how it goes. Of course, let us know how it goes or if you have further questions.
- Mark as New
- Bookmark
- Subscribe
- Mute
- Subscribe to RSS Feed
- Get Direct Link
- Report Inappropriate Content
Re: DOE - replicates vs. repetitions
The Custom Design platform is quite flexible but some features are meant to be used routinely and others as exceptions as needed.
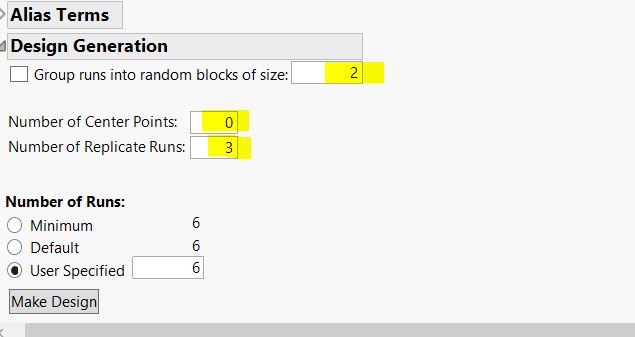
I would not use the Number of Replicates feature. This feature tells JMP that you want a number of replicate runs, not the number of replicates of the entire design. Instead, use the Number of Runs at the bottom. Entire the total number of runs you want here.
I would not use the Center Points feature either. Do you expect the pH to have a linear or a non-linear response to the change in temperature. If it will be linear, then you are done! If it is non-linear, then add the second power of temperature to the model, then you are done! The order of the model will determine the optimum number of levels for temperature. The optima design for the linear model will include only two levels. The optimum design for the second-order model will include three levels.
Why do you measure each sample three times? If it is to reduce measurement error, then continue this practice but only enter the mean measurement for the Y value of that run. Otherwise, the model treats each run as a replicate, that is, a full set up, measurement, and tear down. In your case, it is only the measurement and is not appropriate for estimating the error term in the model.
I am not sure if multiple days are an aspect of your study. Would you complete the entire study in one day or do you expect variation across days and want to include this effect in the analysis? Generally the effect of time is random, not fixed. That is to say that there is variation across days but it is not reproducible, like Tuesday always adds 7% to the mean. If you want to include days, use the random blocks option at the bottom and specify how many runs you intend to run each day.
Please let us know if you have any more questions.
- Mark as New
- Bookmark
- Subscribe
- Mute
- Subscribe to RSS Feed
- Get Direct Link
- Report Inappropriate Content
Re: DOE - replicates vs. repetitions
Thanks for such a detailed answer.
Please, find my clarification below:
- yes, I expect the pH to be a linear function of temperature
- yes, we measure three times to reduce measurement error (high method variability) - so I will use only the mean, right?
- we won't take days into account
- generally, time is the only (but crucial!) factor for us
And additional question, regarding the study:
You mentioned to enter the total number of runs.
How to derive the minimum number of runs for such a study to be statistically significant?

- Mark as New
- Bookmark
- Subscribe
- Mute
- Subscribe to RSS Feed
- Get Direct Link
- Report Inappropriate Content
Re: DOE - replicates vs. repetitions
I'm not sure I understand exactly what you are asking, so I will follow-up with some questions/comments. I apologize in advance for perhaps reading too much into your questions.
1. Is it correct you are experimenting with 1 predictor variable (Temp.) and 1 response variable (pH)? Not sure why you need to use the JMP DOE platform at all as this is a one factor experiment. You can use a directed sampling plan to acquire the data to assign and partition the data into components and then regression to model the data.
2. What are you measuring? ("in normal conditions we measure every sample 3 times"). Are you taking three measures of pH on the "same" sample (in this case getting some estimate of measurement precision).
3. In general, repeated measures are not considered "independent events" so they do not increase degrees of freedom. They are, however, useful for quantifying components of variation. Measuring the same sample multiple times can quantify measurement precision. Measuring 3 consecutive samples can quantify sample-to-sample variation, etc. In a DOE situation, if the multiple "measures" are taken without treatment combinations changing, these are considered repeats (essentially within treatment variation). You can assess consistency of within treatment effects and then, if appropriate, quantify the within treatment variation using both a mean and an estimate of variation (e.g., range, standard deviation, variance). Both the mean and the variation estimate can be modeled as separate Y's.
4. If treatments change between the "experimental units", they are considered independent events called replicates (note I am using the phrase experimental unit (replicate) vs. measurement used for repeats). Replicates can be completely randomized (the archetypical recommended design allowing for "unbiased" estimates of experimental error)) or organized in blocks (which, we can argue, can be treated as random or fixed effects). If treated as fixed effects (particularly useful when you are able to identify the specific noise factors and "manage" them over the course of the experiment), the effects of untested variable (noise) can be estimated and noise-by-factor interactions can be assigned (useful for robust design).
5. Center points are an efficient way to test for non-linear relationships in the design space in factorial designs where you have multiple predictor variables (you only have one so you would simply have a third level to that factor). Center points preserve the orthogonal balance and rotatability. For analysis you can then add one term into the model to assess non-linearity, but that term is confounded for all factors in the model.
- Mark as New
- Bookmark
- Subscribe
- Mute
- Subscribe to RSS Feed
- Get Direct Link
- Report Inappropriate Content
Re: DOE - replicates vs. repetitions
Please find below my comments/answers to your remarks:
- Yes, one predictor and one response. Right now I see that the platform might not be needed...
- We measure one sample 3 times, for precision (high method variability)
- OK, so you would go just for taking the mean value right?
- OK, to be coherent with your proper nomenclature: we have 3 measurements for one experimental unit. Right now, I do not expect other effects/variables for consideration.
- I expect a linear trend. So in this case two factor for temperature would be enough, wouldn't it?
How would you look at this issue?
- Mark as New
- Bookmark
- Subscribe
- Mute
- Subscribe to RSS Feed
- Get Direct Link
- Report Inappropriate Content
Re: DOE - replicates vs. repetitions
Yes, I would model the mean pH versus the temperature. Yes, the optimum design for a linear response uses just two factor levels.
Be sure that the temperature range is wide enough to produce a large change in the pH but not so wide as to change the nature of the phenomenon you are studying. The point of the design is the modeling. You might think in terms of a narrow range in which you obtain the desired pH. You should think in terms of large change in the response produced by a wider range of temperature. This kind of design will give you more precise and more stable estimates of the trend that you want. This case is experimenting and modeling, not just testing. This case is predicting, not 'pick the winner.'
The last point goes to your final question. We talk about the power in a design. The power is the probability that you will find a real effect (i.e., linear trend) to be statistically significant. Let's say that there is a real linear trend but due to a small sample size you often do not find it to be significant. Such outcomes are false negative results. Power is about the opposite: true positives. The statistical decision in a hypothesis test could be described as deciding if the change in the response is much greater than the change due to random variation in the response.
JMP provides a power analysis built into the design platform. I will illustrate how to use it with an example. I open DOE > Custom Design, change the response name to pH and the goal to None. I add a single continuous factor Temperature with a range -1 to +1 (I don't know the actual range). I click Continue and accept the default model for a linear response to Temperature. I decided to start with 8 runs (user defined) and click Make Design. How will this design perform?
Let's say that when the Temperature does not vary that the pH varies as a normal distribution with a standard deviation of 0.2 pH. Let's also say that we anticipate that the pH will minimally change from 6.4 to 7.0 over the range of Temperature in this design. We are now ready to analyze the power in this design.
Open the Power Analysis outline that is within the Design Evaluation outline. There are two equivalent ways to analyze the power. I will show you both of them. First, enter 0.2 for the Anticipated RMSE (response standard deviation). Now, either enter the Anticipated Coefficients or the Anticipated Response. The Anticipated Coefficient is the effect divided by 2. We expect a minimal effect of 7.0 - 6.4 = 0.6 pH so the anticipated coefficient is 0.3. Alternatively, enter 6.4 as the Anticipated Response whenever Temperature = -1 and 7.0 when Temperature = +1. Click either one of the Apply Changes buttons after entering this information.
The custom design should look like this:
If your expectations are right, then the power is 0.939 and you should find an effect of 0.6 pH or greater to be statistically significant practically all the time using this design.
I made up numbers for this example. Try to translate the illustration into your specific case and see how it goes. Of course, let us know how it goes or if you have further questions.

- Mark as New
- Bookmark
- Subscribe
- Mute
- Subscribe to RSS Feed
- Get Direct Link
- Report Inappropriate Content
Re: DOE - replicates vs. repetitions
Repetitions are multiple measurements that could be used to average the response for each treatment. It's not a replicate !!
Center points are not considered repetitions as the measurements usually taken from another run.
Response averages could be retrieved for the specific treatments using a separate data table.
- Mark as New
- Bookmark
- Subscribe
- Mute
- Subscribe to RSS Feed
- Get Direct Link
- Report Inappropriate Content
Re: DOE - replicates vs. repetitions
Perhaps of equal or more importance is the repeats provide an estimate of the variation. If your problem is variation, you need to model what factors affect variation not just the mean.
Recommended Articles
- © 2026 JMP Statistical Discovery LLC. All Rights Reserved.
- Terms of Use
- Privacy Statement
- Contact Us