- New to JMP? Join us Sept. 23-24 for the Early User Edition of Discovery Summit, tailor-made for new users. Register now for free!
- Your voice matters! Tell us how you prefer to receive JMP updates, so we can tailor our communication to your needs. Take short survey.
- See how to access JMP Marketplace - and - find, create & share add-ins to extend your JMP. Watch video.
- Subscribe to RSS Feed
- Mark Topic as New
- Mark Topic as Read
- Float this Topic for Current User
- Bookmark
- Subscribe
- Mute
- Printer Friendly Page
Discussions
Solve problems, and share tips and tricks with other JMP users.- JMP User Community
- :
- Discussions
- :
- Re: DOE augmentation help with an already blocked design

- Mark as New
- Bookmark
- Subscribe
- Mute
- Subscribe to RSS Feed
- Get Direct Link
- Report Inappropriate Content
DOE augmentation help with an already blocked design
Hi there,
I was hoping I could get some help with an experiment I am currently running?
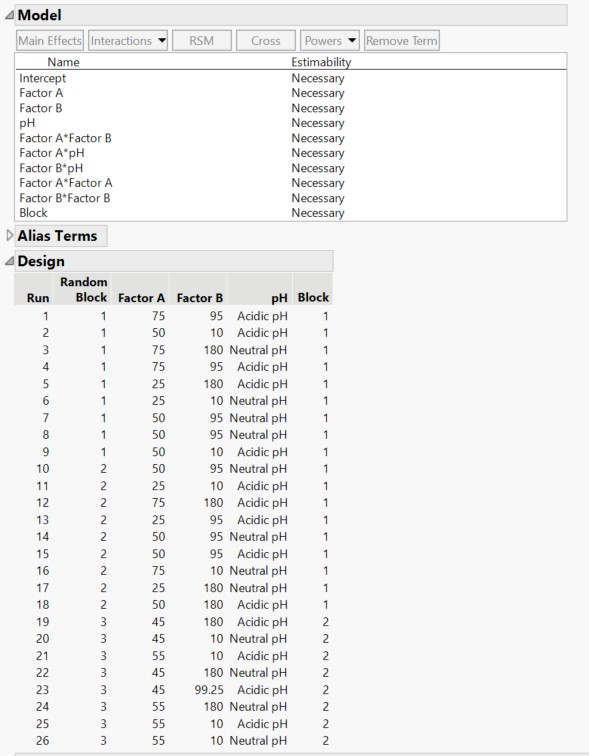
It is a custom design with 3 factors in total. 2 continuous variables and 1, 2-level categorical variable. This is ran on JMP 15.2
Lets call them
Continuous factor 1 = A (Range 25-75), Continuous factor 2 =B (Range 10-180) and Categorical factor= C( Acid, Neutral)
I was interested in collecting information in the middle of the range of the continuous variables as well as any 2nd order interactions so the model contains the main effects, 2nd order interactions and the quadratic terms for the continuous variables.
The default design suggested a 18 run design which was too many runs for one day so I selected to group the design into two blocks of 9 runs.
Block 1 of testing has now been completed and it is clear from eyeballing the data that Factor A appears to be the most important factor by far and that optimal results are only going to be found around the midpoint of this factor. Block two of testing will proceed as planned but I am already thinking of how best to fix Factor A to its midpoint while seeing what impact varying factor B and C will have.
Would it be possible to augment the design while locking Factor A to its mid point or would this be difficult as the design already contains a blocking factor and augmentation would add a third blocking factor to the mix?
Accepted Solutions

- Mark as New
- Bookmark
- Subscribe
- Mute
- Subscribe to RSS Feed
- Get Direct Link
- Report Inappropriate Content
Re: DOE augmentation help with an already blocked design
Hi @Students_Tea,
Following your different remarks/informations and questions :
- Completely aligned with your goal. The design choice seems well aligned with your objective and the knowledge you want to gather. In order to build a predictive model, I would probably have suggested adding points in a more "randomly uniform" way (augmenting through Space-Filling design for example), to homogeneize and reduce the distances between points, enable a better and more uniform coverage of your experimental space, and be able to use Machine Learning models, which may offer better predictive performances.
- Thanks for the information. It is helpful to understand the experimental context and better visualize the "full picture".
- If your experiment is a dissolution experiment, it may also be worth to investigate the speed of dissolution depending on your factors. Do you have measurements at different time points or a proxy response ?
- Ok, if the order of the experiments is the same as the one in datatable, you may have a measurement drift or a slow drift happening during the experiments. It may be worth to investigate this, particularly if you already have some idea about the source(s).
- You can still augment your design, but this autocorrelation problem may be hiding/masking some effects, and provoke a mis-estimation of the parameters estimates in the model. If you can solve or reduce this problem and then augment, the newly generated data can help better estimate the coefficients in the model, so your initial set is still relevant (a little less informative maybe as it could have been).
- The reduction of the range for factor A is a good idea. Make sure the range is not too small to enable variation in your response. In the augmentation process, as the minimum number of runs for augmentation is 8, you could generate 8 runs with the Augment Design platform and add a centre point "manually" (you may have to choose a level for the categorical factor however) in the datatable.
- Concerning the blocking factor, you can check the Wald p-value in the REML Variance Component Estimates report (not sure if/how this panel appear in JMP 15, here are the explanations from JMP Help Restricted Maximum Likelihood (REML) Method) :
Here the Wald p-value is at 0,5 so it indicates that the random block effect may not be significantly different from 0. However, this random block effect does capture 64% of your total residual variance.

Hope this answer might be helpful,
"It is not unusual for a well-designed experiment to analyze itself" (Box, Hunter and Hunter)
- Mark as New
- Bookmark
- Subscribe
- Mute
- Subscribe to RSS Feed
- Get Direct Link
- Report Inappropriate Content
Re: DOE augmentation help with an already blocked design
Hi @Students_Tea,
Welcome in the Community !
When creating a design using blocking like you did, you group experimental runs into blocks that are similar to each other. The repartition of factors levels should be similar between blocks 1 and 2, so if you can't run experiments of block 2, the situation is similar to using a fraction of the full design. Using only half of the experiments planned in this situation will however results in :
- High reduction of power to detect significant main effects and higher order effects:
- Higher prediction variance :
- Higher uncertainty for parameters estimates :
- Increase correlations between effects :


So you may already have detected a significant effect for factor A, both statistically and with a large effect size, but since you're degrading the ability to detect effects (and particularly higher order effects in which you seem to be interested) when using only the first block of your complete design, I would recommend running the other planned experiments from block 2 to better estimate effect from factor A and give you the ability to detect other effects (main effects and higher order effects).
You could also augment the design and changing the ranges of the factors : if A has a predominant effect on your response, you could augment your initial set of experiments from block 1 and restrict the levels/range of A to narrower values centered around the intermediate level (if you had good results in this area). This could help reduce the relative importance of factor A on the response. You could also expand ranges from factor 2, if it makes sense, to enable an easier detection of an effect.
I wouldn't fix a factor at this stage, you have a limited number of factors to study and very low power to detect effect when using only a fraction of your complete design. Fixing a factor so early in the experimentation stages could prevent you from detecting possible interaction between A and B, as well as a more precise estimation of possible quadratic effect of A and its main effect. Maybe the detection of interactions and quadratic effects (not yet detected at this stage) could lead you to a better optimum and a better overview and understanding of your system.
I attached a design similar to the one you seem to have so that you can reproduce the design comparison (full and subset with block 1 only) with the Compare Designs platform.
Hope this answer may help you,
"It is not unusual for a well-designed experiment to analyze itself" (Box, Hunter and Hunter)
- Mark as New
- Bookmark
- Subscribe
- Mute
- Subscribe to RSS Feed
- Get Direct Link
- Report Inappropriate Content
Re: DOE augmentation help with an already blocked design
Hi @Victor_G
Thanks very much for the follow up. I may have been a little unclear with how I plan to follow up the work from today.
My intention is to run Block 2 of the experiment as originally planned as I realise that it would mess up the design and the ability to glean information from the work performed so far if I did not do that.
"You could also augment the design and changing the ranges of the factors : if A has a predominant effect on your response, you could augment your initial set of experiments from block 1 and restrict the levels/range of A to narrower values centered around the intermediate level (if you had good results in this area). This could help reduce the relative importance of factor A on the response. You could also expand ranges from factor 2, if it makes sense, to enable an easier detection of an effect."
I think what you wrote above seems like the right idea. Expanding ranges for factor 2 doesn't really work in this case as the limits are essentially up against a practical wall so while we could make them wider any value derived beyond those limits just isn't practically useful.
I imagine it must be possible to Augment the experiment once the Block 1 and Block 2 parts are done but my knowledge of DOE's is not great. When I go to use the Augment Design (As a test) the existing Blocking factor in the design comes in as a choice. Should the existing blocking factor be included as an X-factor? When I do that, restrict the value of Factor A around the intermediate value and then then group new runs into a separate Block I end up with a design that's now 26 runs long in total and contains three separate random blocks and 2 Blocks. It appears its blocked the first two blocks into 1 block and then the augmented runs into a second block. It also doesn't contain any additional center points for A which I'm not sure if that's an issue. I do suspect the optimal values is at the midpoint of A so it would be nice to get some additional data at that point but maybe the design doesn't need it?
Please see attached for the design that comes up when I augmented the existing design as described above.
- Mark as New
- Bookmark
- Subscribe
- Mute
- Subscribe to RSS Feed
- Get Direct Link
- Report Inappropriate Content
Re: DOE augmentation help with an already blocked design
Hi @Students_Tea,
Thanks for the clarification and sorry for my misunderstanding.
If you try to include your Random Block in the panel of the factors in the Augment Designs platform, then the random block factor will be removed in the next window :

In your situation, what you could do is enter your factors A, B and C in the Augment Designs platform, modify the levels (if needed) for factor A, and check the option "Group new runs into separate block".
With the same assumed model (main effects, 2-factors interactions and quadratic effects), the number of added runs recommended by JMP would be 8, so you can increase this number to 9 (to match the number of runs in previous random blocks from the original design), and you'll get this design (note that I changed min level of factor A to 40 and max level to 60):

As you say, you will have three random blocks, and two blocks.
You could proceed with the analysis by using the 3 random blocks to check that the experimental variance in your experiments remains stable/constant (using a random effect through a Mixed model to assess its statistical significance). If you detect a statistical significance, check the effect size and where is the significant difference between the random blocks.
Hope this answer may help you,
"It is not unusual for a well-designed experiment to analyze itself" (Box, Hunter and Hunter)
- Mark as New
- Bookmark
- Subscribe
- Mute
- Subscribe to RSS Feed
- Get Direct Link
- Report Inappropriate Content
Re: DOE augmentation help with an already blocked design
Hi @Victor_G,
Thanks for you previous response. It's very helpful. The second day of data has just come in from the other half of the original design.
At first glance it appears that Factor A indeed has the biggest effect size looking at the response and so I was thinking of augmenting the design like you mentioned with a narrower range around Factor A. It appears that the quadratic effect of A (if I'm getting that right) is the biggest effect by far and this is obvious in the profiler from essentially a large curve with the minima in the center of the curve. One concern I have is that the raw data in its current form may not be great for telling me about Factors B and C.
For example it should be the case that at around the midpoint of Factor A, an increase in Factor B will result in the response lowering. The response can be a positive integer including zero but never less than zero. This is actually shown in the data but due to the large absolute values involved with the lowest and highest ranges of Factor A I think this is somewhat masked. When using the profiler for example and maximizing the desirability, Factor B is set to the lowest value 10, even though we know its capable of giving lower responses at the highest number 180.
I think another reason could be that the data is heteroscedastic? Part of me is wondering if it would be better to do some sort of transformation on the raw data (log or square root) to equalize out some of that variance so that the model can more easily distinguish the magnitude of the other factors? Does this sound like a good idea based on the data or does JMP correct for this?
Please see attached for the data table and Fit model parameters that are recommended.
- Mark as New
- Bookmark
- Subscribe
- Mute
- Subscribe to RSS Feed
- Get Direct Link
- Report Inappropriate Content
Re: DOE augmentation help with an already blocked design
Hi @Students_Tea,
I would recommand looking at your models residuals to better evaluate if the linear regression assumptions are met. I won't copy-paste a previous complete answer I did on this topic, you can look here : Solved: Re: Interpretation related to response model (RSM) - JMP User Community
Relaunching the models you have created, I don't see a specific pattern of heteroscedasticity for response A, but you seem to have it for response B and C. The heteroscedasticity detected in the residual plots and the fact that your responses cover many order of magnitude (from 10-100 to 10000-100000) are strong indications that a transformation may be needed (log or other transformations).
However, the principal problem I noticed in the "Residual by Row" plot for responses A and B is the presence of a non-random patterm, where the residuals follow a tendancy to decrease and becoming negative :

As your random block effect doesn't seem to be significant from the first models analysis, I also launched models without this random effect to check the auto-correlation between points with the Durbin-Watson Test (available in Row Diagnostics), and the test is statistically significant for responses A and B, example here with response A :

Also note the Lack-of-Fit test appears also to be significant, meaning a transformation could be needed and/or terms not included in the model (higher order terms) might be missing, see Lack of Fit.
When trying Box-Cox Y Transformation, JMP recommends transformations with coefficients at 0,485 - 0,32 and 0,334 for responses A, B and C. This indicates that a transformation may be indeed necessary to improve the quality of model fit.
Note however that this won't change or solve the situation about non-randomness of the residuals depending on time/rows.
I would suggest investigating in priority where this pattern may come from, before launching any new tests (unless the order in the datatable is different from the order in which experiments have been done ?).
You can find attached your file with two scripts added : one for models with the random effect, and one for models without this random effect (to check autocorrelation diagnostic and Box-Cox transformations recommandations).
Hope this response may help you,
"It is not unusual for a well-designed experiment to analyze itself" (Box, Hunter and Hunter)
- Mark as New
- Bookmark
- Subscribe
- Mute
- Subscribe to RSS Feed
- Get Direct Link
- Report Inappropriate Content
Re: DOE augmentation help with an already blocked design
Hi @Victor_G,
Once again thanks for the response. I feel like I'm getting a better idea of how everything works. I guess I should add that the goal of these experiments is to minimize the responses and that creating a predictive model isn't the goal. Really I just need something that's good enough to tell me with decent confidence what the best combination of factors is that can minimize the responses.
Its probably useful if I give you some more background on the actual experiment. Its essentially a dissolution experiment but the responses are a proxy for how much material is left undissolved. So as the responses go down this shows better dissolution. We expect the Reponses to be very high at the least optimal conditions showing close to no dissolution, but as we reach more optimal conditions this value will approach zero with zero meaning complete dissolution of the DP, which is the goal.
Factor A is the percentage of one solution a binary solution of Aqueous and organic solvents.
Factor B is a stir time in minutes. For practical reasons this can not be extended beyond 180 minutes.
Factor C is whether Factor A is neutral or Acidic.
Previous experiments have been done with a neutral solution so I was not completely in the dark with what the results should be. It was shown previously that the optimal Factor A was very close to the midpoint with a neutral pH solution and that longer stir times meant more dissolution. I had a hypothesis that acidifying the solution might increase the dissolution so I opted for this experiment which was sort of a head to head of the neutral solutions with the acidic solutions. I thought that acidifying the solvent though might change the dissolution profile and shift the optimal level of factor A either to the left or right which is why the range is set relatively wide.
From the results obtained so far this does not appear to be true and if anything acidifying the solution appears to make the responses worse across the board. At the same time I would like to dig a little deeper and show that this remains the case when Factor A is near its optimal level. In addition I would like for the model to show that dissolution increases with factor B as this would be expected. at least for the neutral solutions anyway.
You mentioned that of primary concern was residual by row plot where there appeared to be a non-random pattern. This appears to be autocorrelation which I would agree. I can confirm that the order of the experiments in the data table does match the order in which the were actually performed.
I had a think about how the experiment was performed and after careful consideration I believe that this may have been caused by carry over effects. This makes the most sense to me for the system. Steps were taken to prevent this but looking at the data it appears that this was not completely removed from the experiment and so I can look at taking extra measures in the future to remove this completely.
With this in mind would it still be appropriate to perform an augmentation of this experiment? I would like to keep the data generated so far as it does match up with past experiments that have been performed in the broad strokes.
At this point I really only have one singular experiment left before unfortunately I have to pick some parameters to move forward with. I expect the optimal parameters to be somewhere around the midpoint of Factor A. The expectation is also that dissolution increases with stir time but whether there is a meaningful difference between 10 minutes and 180 minutes when factor A is near optimal is not yet borne out in the data. And lastly I'm not sure if Factor C is important when Factor A and Factor B is near optimal.
As such my thought is to augment the experiment from the ranges of 45-55 for factor A while keeping the other factors the same. 9 more runs seems appropriate as you explained earlier to include the blocking factor. Is does seem to be a pity that it won't let you add more center points in the augmentation process as really I would like to see how Factors B and C behave when factor A is exactly at the midpoint.
As for data transformation, it certainly seems from the Box-Cox values that somewhere between a ln or square root of y would give better results so I will likely use those transformed values in future for the model.
Lastly you mentioned that the blocking factor did not seem like a significant explanatory variable where did you get that information from?
Thanks,
- Mark as New
- Bookmark
- Subscribe
- Mute
- Subscribe to RSS Feed
- Get Direct Link
- Report Inappropriate Content
Re: DOE augmentation help with an already blocked design
Hi @Students_Tea,
Following your different remarks/informations and questions :
- Completely aligned with your goal. The design choice seems well aligned with your objective and the knowledge you want to gather. In order to build a predictive model, I would probably have suggested adding points in a more "randomly uniform" way (augmenting through Space-Filling design for example), to homogeneize and reduce the distances between points, enable a better and more uniform coverage of your experimental space, and be able to use Machine Learning models, which may offer better predictive performances.
- Thanks for the information. It is helpful to understand the experimental context and better visualize the "full picture".
- If your experiment is a dissolution experiment, it may also be worth to investigate the speed of dissolution depending on your factors. Do you have measurements at different time points or a proxy response ?
- Ok, if the order of the experiments is the same as the one in datatable, you may have a measurement drift or a slow drift happening during the experiments. It may be worth to investigate this, particularly if you already have some idea about the source(s).
- You can still augment your design, but this autocorrelation problem may be hiding/masking some effects, and provoke a mis-estimation of the parameters estimates in the model. If you can solve or reduce this problem and then augment, the newly generated data can help better estimate the coefficients in the model, so your initial set is still relevant (a little less informative maybe as it could have been).
- The reduction of the range for factor A is a good idea. Make sure the range is not too small to enable variation in your response. In the augmentation process, as the minimum number of runs for augmentation is 8, you could generate 8 runs with the Augment Design platform and add a centre point "manually" (you may have to choose a level for the categorical factor however) in the datatable.
- Concerning the blocking factor, you can check the Wald p-value in the REML Variance Component Estimates report (not sure if/how this panel appear in JMP 15, here are the explanations from JMP Help Restricted Maximum Likelihood (REML) Method) :
Here the Wald p-value is at 0,5 so it indicates that the random block effect may not be significantly different from 0. However, this random block effect does capture 64% of your total residual variance.
Hope this answer might be helpful,
"It is not unusual for a well-designed experiment to analyze itself" (Box, Hunter and Hunter)
- Mark as New
- Bookmark
- Subscribe
- Mute
- Subscribe to RSS Feed
- Get Direct Link
- Report Inappropriate Content
Re: DOE augmentation help with an already blocked design
Hi @Victor_G ,
To answer your question the speed of dissolution is in essence given by the raw data. As time is Factor B this is directly measured so we have a three points anyway over which dissolution is measured per replicate.
The slow drift I'm not so sure about. I'll have to see more data from further experiments to see if this is something that holds true. My feeling is that its related to the autocorrelation issue. Essentially the design matrix pushed a bunch of the samples which would give lower results into the second block. There seemed to be carry over from some of the worst sample conditions so in the case of the best samples conditions this actually meant there was little to no carry over for those samples. Essentially if a bad sample was followed by a bad sample then the results were elevated. If a good sample was followed by a good sample then the the results were depressed compared to the average. I'm pretty sure this is what was being picked up and looking at the time series autocorrelation checker those match up pretty much exactly. This can be corrected in future by more cleaning between sample runs.
Anyway I'll have to wait for the the results to come back in but thank you very much. You've been a massive help.
Recommended Articles
- © 2026 JMP Statistical Discovery LLC. All Rights Reserved.
- Terms of Use
- Privacy Statement
- Contact Us