- Subscribe to RSS Feed
- Mark Topic as New
- Mark Topic as Read
- Float this Topic for Current User
- Bookmark
- Subscribe
- Mute
- Printer Friendly Page
Discussions
Solve problems, and share tips and tricks with other JMP users.- JMP User Community
- :
- Discussions
- :
- Customize graph
- Mark as New
- Bookmark
- Subscribe
- Mute
- Subscribe to RSS Feed
- Get Direct Link
- Report Inappropriate Content
Customize graph
Dear JMP Experts,
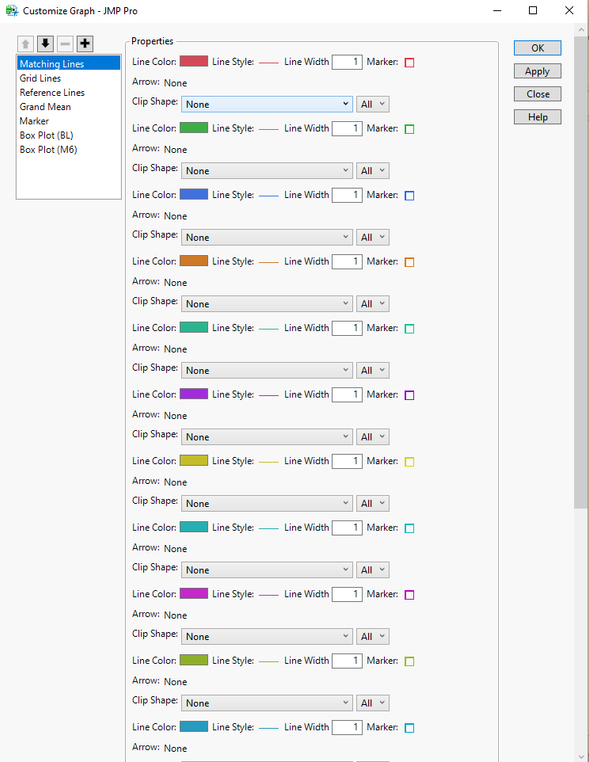
I would like to inquire about the Fit Y by X>customize graph pop up window (bellow). Is there any trick that can help to change, color or the line style for all the lines at once? I know that I can fit multiple correlations, for example, by holding the key Control. Is there something similar here? Thanks!
Accepted Solutions
- Mark as New
- Bookmark
- Subscribe
- Mute
- Subscribe to RSS Feed
- Get Direct Link
- Report Inappropriate Content
Re: Customize graph
Hi @Johnanderson,
There isn't a way to broadcast a selection in the customize panel the way you can within a report (i.e. holding the control, or command key). When I have to make changes like this when there are hundreds of lines to customize I usually resort to scripting. Have you used JMP scripting before? With a few modifications you could accomplish this with the following script:
Open("$SAMPLE_DATA/Cholesterol Stacked.jmp");

//launch the oneway analysis
ow = Oneway(
	Y( :Y ),
	X( :Time ),
	Matching Column( :Patient ),
	X Axis Proportional( 0 ),
	Matching Lines( 1 ),
);

//wait for 2 sec so you can see the change
Wait(2);

//make a referernce to the frame that's holding the lines
owFB = Report( ow )[Framebox( 1 )];

//loop through from 1 to 20 (patients) and set the line style
for(i=1,i<=20,i++,
	owFB << DispatchSeg(LineSeg(i), {Line Style("Dotted")})
);
To make this work for your situation you would need to replace the analysis script I used with your own, and modify the number of lines that need to be styled (I had 20 sets in this example).
I hope this helps!
- Mark as New
- Bookmark
- Subscribe
- Mute
- Subscribe to RSS Feed
- Get Direct Link
- Report Inappropriate Content
Re: Customize graph
Hi @julian , I appreciate your response. I never used scriting in JMP, as all the process that I conduct are strait forward. I will consider using scritping going forward. Many thanks!
Recommended Articles
- © 2026 JMP Statistical Discovery LLC. All Rights Reserved.
- Terms of Use
- Privacy Statement
- Contact Us

