- Subscribe to RSS Feed
- Mark Topic as New
- Mark Topic as Read
- Float this Topic for Current User
- Bookmark
- Subscribe
- Mute
- Printer Friendly Page
Discussions
Solve problems, and share tips and tricks with other JMP users.- JMP User Community
- :
- Discussions
- :
- Re: Curve not populating in analysis (4PL Logistic)

- Mark as New
- Bookmark
- Subscribe
- Mute
- Subscribe to RSS Feed
- Get Direct Link
- Report Inappropriate Content
Curve not populating in analysis (4PL Logistic)
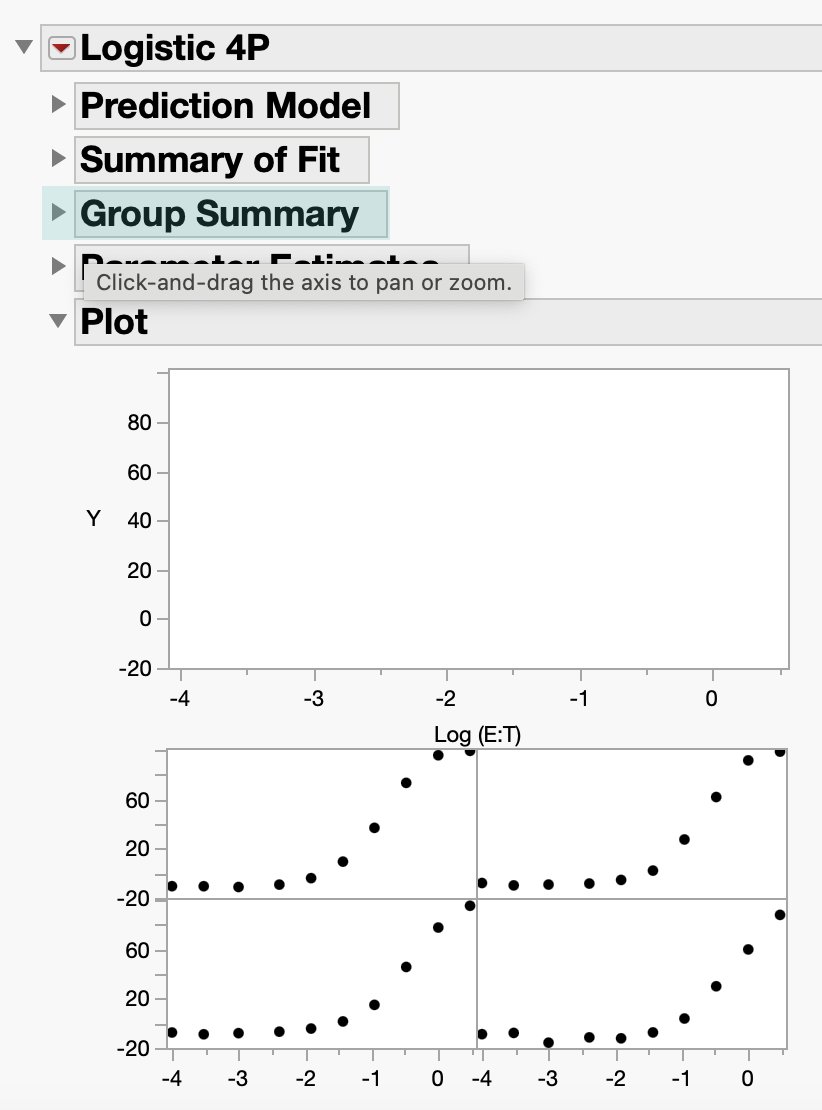
I am trying to get a summary graph of my 4 PL curves from the analysis that I did. However, the summary graph containing are not populating with the curves. I've attached some screenshots for reference. Thank you in advance for all of your help!

- Mark as New
- Bookmark
- Subscribe
- Mute
- Subscribe to RSS Feed
- Get Direct Link
- Report Inappropriate Content
Re: Curve not populating in analysis (4PL Logistic)
I used an old training example with a reference and unknow curve. I get this after fitting a Logistic 4P model:


What version of JMP are you using? How did you start your analysis? Can you share a picture of the launch dialog you used? Which model did you select from the red triangle menu? What other information appeared in the window after you fit the model?

- Mark as New
- Bookmark
- Subscribe
- Mute
- Subscribe to RSS Feed
- Get Direct Link
- Report Inappropriate Content
Re: Curve not populating in analysis (4PL Logistic)
Not sure if this will help?
In an analysis of a very similar data set...
1. The initial plot doesnt' have a curve fit, because it doesn't have a model to make the curve yet

2. After fitting a model:

The fitted curve is displayed in the fit of the model

Recommended Articles
- © 2026 JMP Statistical Discovery LLC. All Rights Reserved.
- Terms of Use
- Privacy Statement
- Contact Us